Fig. A.1
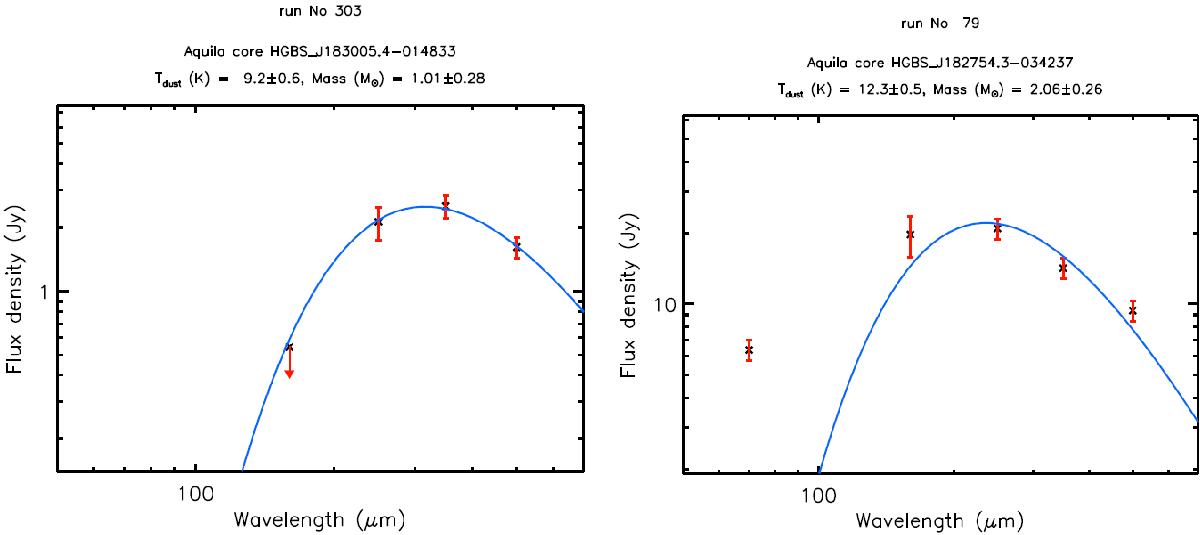
Examples of Herschel spectral energy distributions (SEDs) for a prestellar core (left, see Fig. A.3 for the corresponding image cutouts) and a protostellar core (right, see Fig. A.4 for the corresponding image cutouts). These SEDs were constructed from the background-subtracted integrated flux densities (cross symbols) measured by getsources. A graybody fit to the SED observed longward of 160 μm is superimposed as a blue curve in both panels. Only upper limits are available at 70 μm and 160 μm for the prestellar core shown in the left panel. A single-temperature graybody rarely provides a good fit to the overall SED of a protostellar core but can nevertheless describe the SED longward of 160 μm reasonably well (cf. right panel). Similar SED plots are provided on http://gouldbelt-herschel.cea.fr/archives for all selected cores.
Current usage metrics show cumulative count of Article Views (full-text article views including HTML views, PDF and ePub downloads, according to the available data) and Abstracts Views on Vision4Press platform.
Data correspond to usage on the plateform after 2015. The current usage metrics is available 48-96 hours after online publication and is updated daily on week days.
Initial download of the metrics may take a while.