Fig. 18
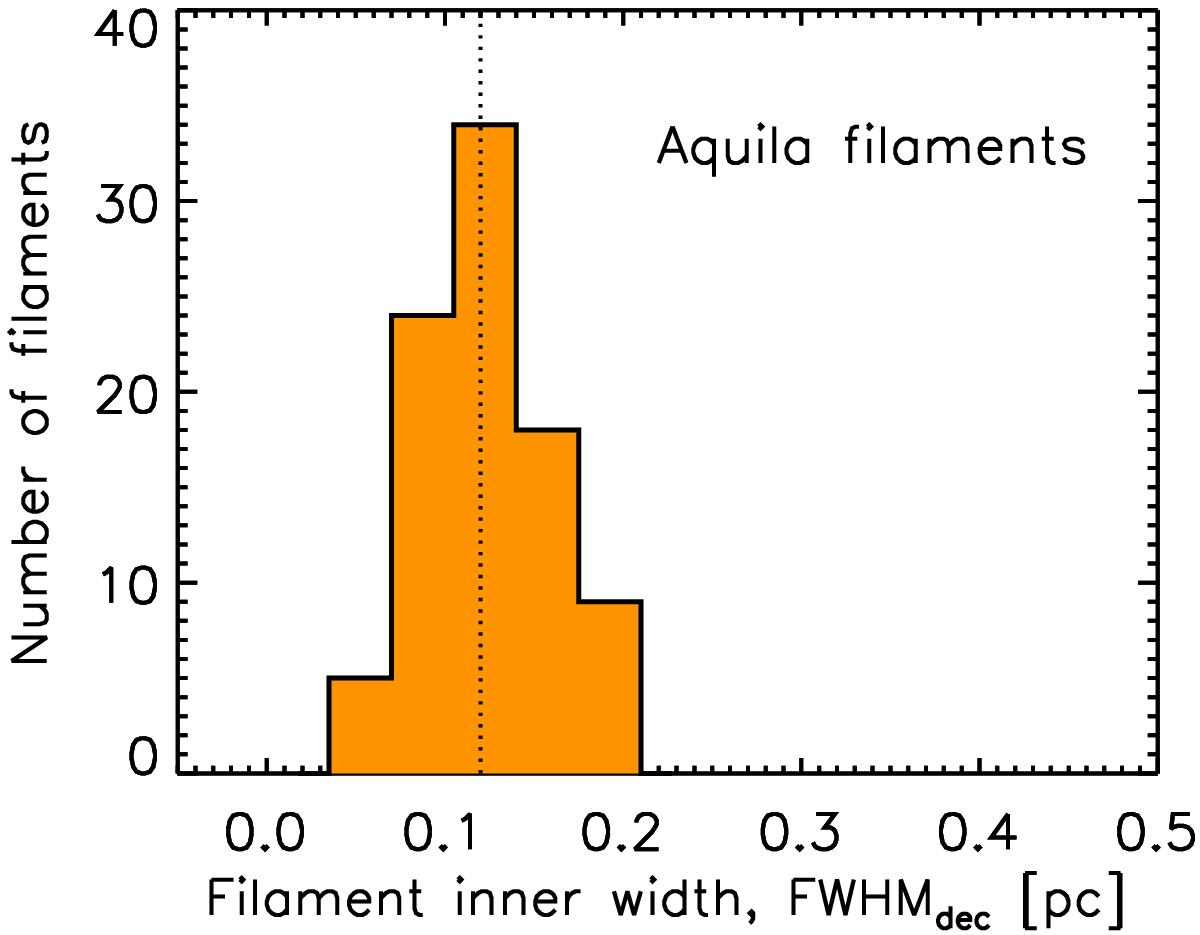
Distribution of mean FWHM inner widths for the 90 filaments traced with DisPerSE in the Aquila entire field (see blue skeleton in Figs. 3 and 4 and Sect. 4.2). These widths result from a filament profile analysis similar to that described in Arzoumanian et al. (2011) and were deconvolved from the 18.2″ HPBW resolution of the high-resolution column density map used to construct the radial profiles of the filaments. The median filament width is 0.12 pc, as marked by the vertical dotted line, and the standard deviation of the distribution is 0.04 pc.
Current usage metrics show cumulative count of Article Views (full-text article views including HTML views, PDF and ePub downloads, according to the available data) and Abstracts Views on Vision4Press platform.
Data correspond to usage on the plateform after 2015. The current usage metrics is available 48-96 hours after online publication and is updated daily on week days.
Initial download of the metrics may take a while.