Fig. 17
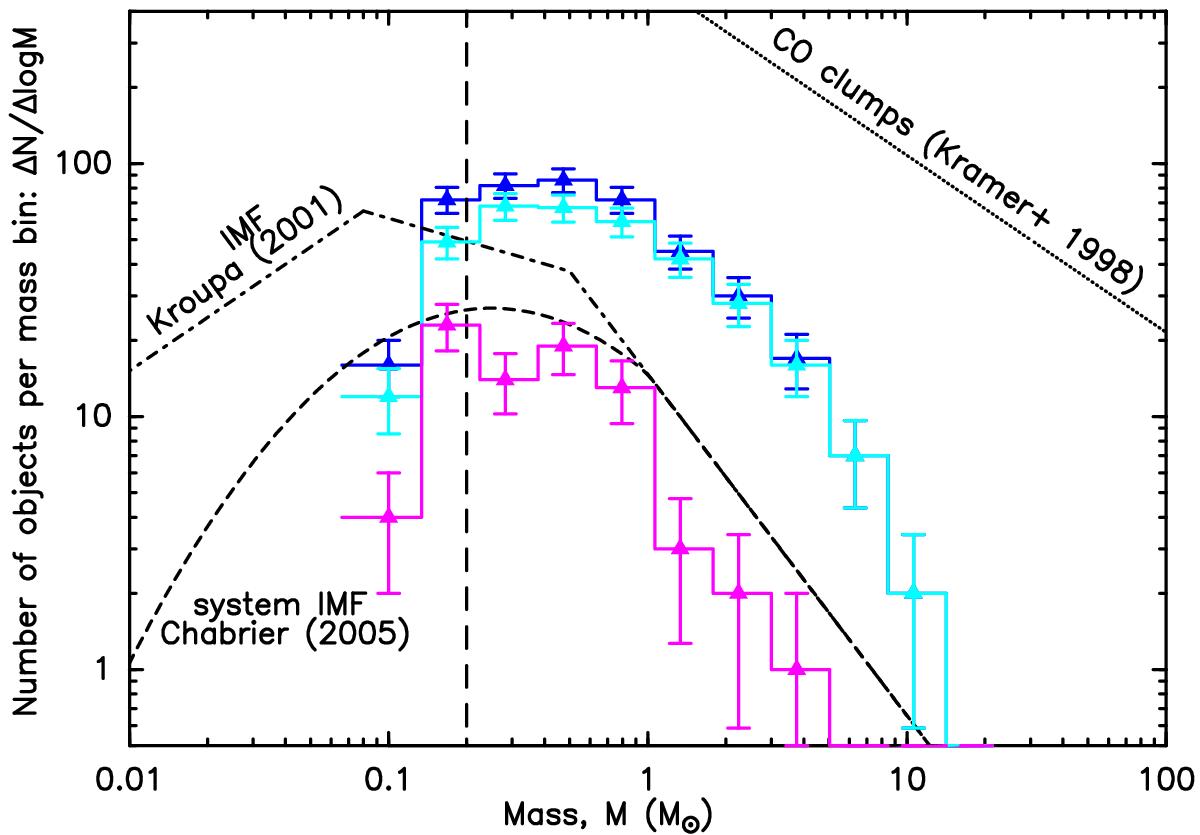
Comparison of the CMF observed for the majority (~81%) of candidate prestellar cores lying within the 0.2 pc-wide footprints of the DisPerSE-detected filaments (light blue histogram) to that observed for the minority (~19%) of prestellar cores lying outside these filaments (magenta histogram). The upper dark blue histogram and the other lines are the same as in Fig. 16. (Color figure is available in the online version.)
Current usage metrics show cumulative count of Article Views (full-text article views including HTML views, PDF and ePub downloads, according to the available data) and Abstracts Views on Vision4Press platform.
Data correspond to usage on the plateform after 2015. The current usage metrics is available 48-96 hours after online publication and is updated daily on week days.
Initial download of the metrics may take a while.