Fig. 16
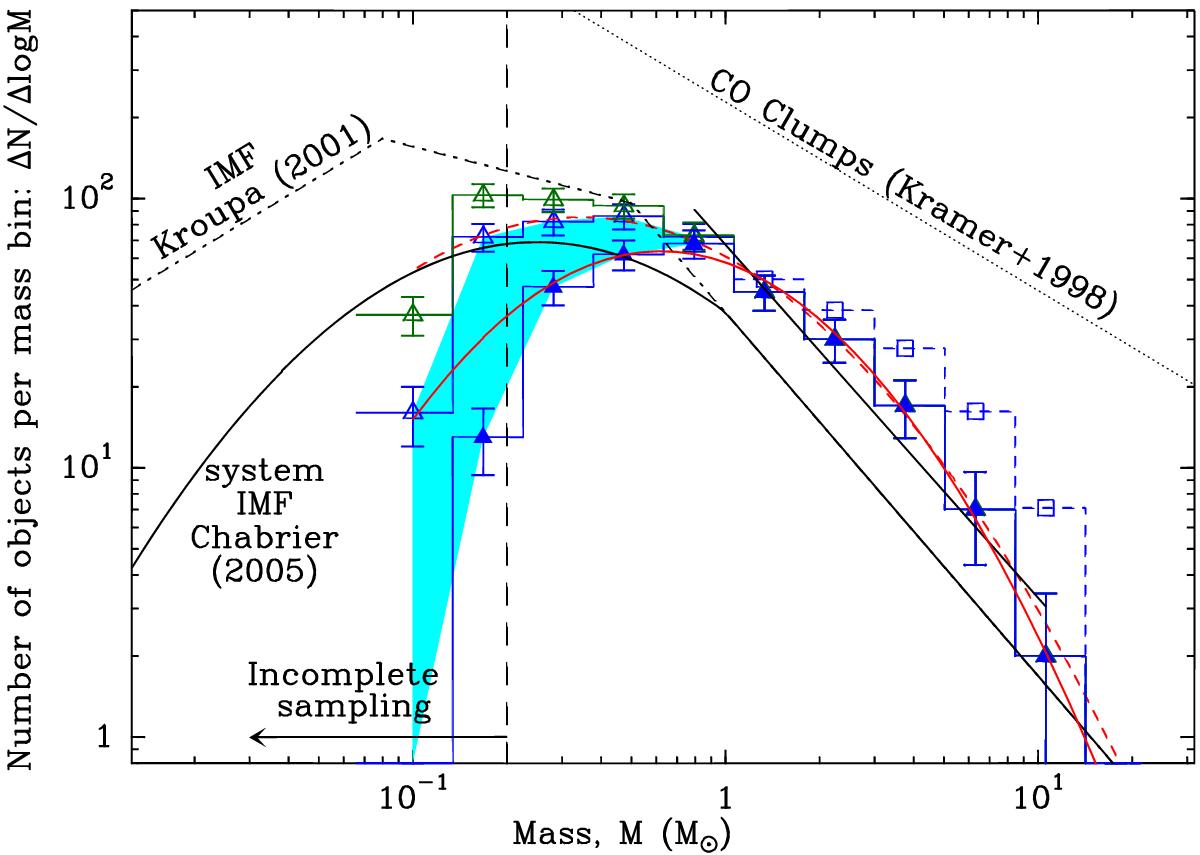
Differential core mass function (dN/dlogM) of the 651 starless cores (dark green histogram), 446 candidate prestellar cores (upper blue histogram and open triangles), and 292 robust prestellar cores (lower blue histogram and filled triangles) identified with Herschel in the whole Aquila field. The error bars correspond to ![]() statistical uncertainties. The shaded area in light blue reflects the uncertainties in the prestellar CMF arising from the uncertain classification of observed starless cores as gravitationally bound or unbound objects (see Sect. 4.7). The dashed blue histogram and open squares show how the prestellar CMF would change at the high-mass end after correction for a possible differential timescale bias (see text). The 90% completeness level of the prestellar core sample is indicated by the vertical dashed line (see Sect. 4.8 and Appendix B). Lognormal fits to the CMF of robust and candidate prestellar cores (solid and dashed red curves, respectively), as well as a power-law fit to the high-mass end of the CMF (black solid line) are superimposed. The two lognormal fits peak at 0.62 M⊙ and 0.34 M⊙, and have standard deviations of ~0.47 and ~0.57 in log10M, respectively. The power-law fit has a slope of −1.33 ± 0.06 (compared to a Salpeter slope of −1.35 in this format). The IMF of single stars (corrected for binaries – e.g., Kroupa 2001), the IMF of multiple systems (e.g., Chabrier 2005), and the typical mass distribution of CO clumps (e.g., Kramer et al. 1998) are also shown for comparison. (Color figure is available in the online version.)
statistical uncertainties. The shaded area in light blue reflects the uncertainties in the prestellar CMF arising from the uncertain classification of observed starless cores as gravitationally bound or unbound objects (see Sect. 4.7). The dashed blue histogram and open squares show how the prestellar CMF would change at the high-mass end after correction for a possible differential timescale bias (see text). The 90% completeness level of the prestellar core sample is indicated by the vertical dashed line (see Sect. 4.8 and Appendix B). Lognormal fits to the CMF of robust and candidate prestellar cores (solid and dashed red curves, respectively), as well as a power-law fit to the high-mass end of the CMF (black solid line) are superimposed. The two lognormal fits peak at 0.62 M⊙ and 0.34 M⊙, and have standard deviations of ~0.47 and ~0.57 in log10M, respectively. The power-law fit has a slope of −1.33 ± 0.06 (compared to a Salpeter slope of −1.35 in this format). The IMF of single stars (corrected for binaries – e.g., Kroupa 2001), the IMF of multiple systems (e.g., Chabrier 2005), and the typical mass distribution of CO clumps (e.g., Kramer et al. 1998) are also shown for comparison. (Color figure is available in the online version.)
Current usage metrics show cumulative count of Article Views (full-text article views including HTML views, PDF and ePub downloads, according to the available data) and Abstracts Views on Vision4Press platform.
Data correspond to usage on the plateform after 2015. The current usage metrics is available 48-96 hours after online publication and is updated daily on week days.
Initial download of the metrics may take a while.