Fig. 15
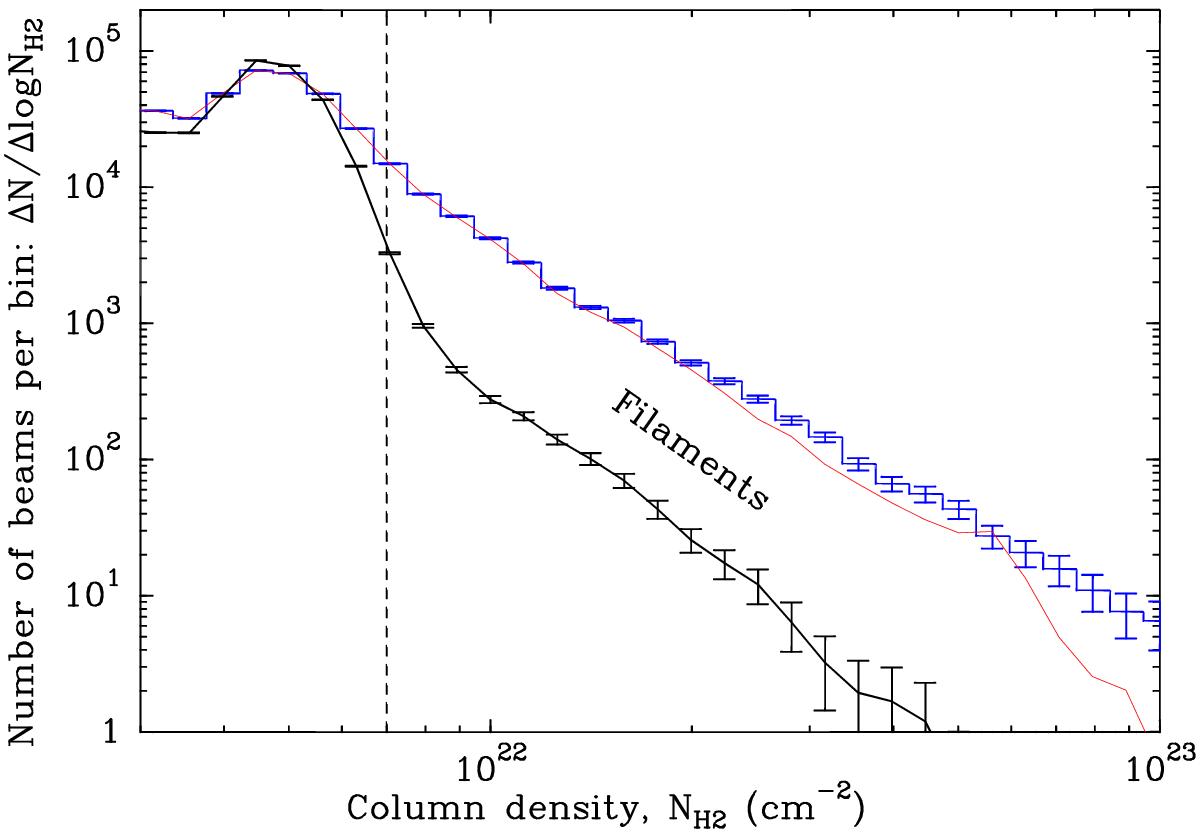
Comparison of the global column density PDF in the Aquila cloud (blue histogram with statistical error bars, identical to that shown in Fig. 5a) to the column density PDF measured after subtraction of dense cores (red solid line) and the PDF measured after subtraction of both dense cores and filaments (black solid line with statistical error bars). The vertical dashed line marks the same fiducial threshold at ![]() as in Fig. 11. This plot illustrates that filaments make up a dominant (~50%–75%) fraction of the dense gas mass at AV> 7–10, and that dense cores contribute only a small (≲15%) fraction of the dense gas (except perhaps at the very highest column densities). (Color figure is available in the online version.)
as in Fig. 11. This plot illustrates that filaments make up a dominant (~50%–75%) fraction of the dense gas mass at AV> 7–10, and that dense cores contribute only a small (≲15%) fraction of the dense gas (except perhaps at the very highest column densities). (Color figure is available in the online version.)
Current usage metrics show cumulative count of Article Views (full-text article views including HTML views, PDF and ePub downloads, according to the available data) and Abstracts Views on Vision4Press platform.
Data correspond to usage on the plateform after 2015. The current usage metrics is available 48-96 hours after online publication and is updated daily on week days.
Initial download of the metrics may take a while.