Fig. 14
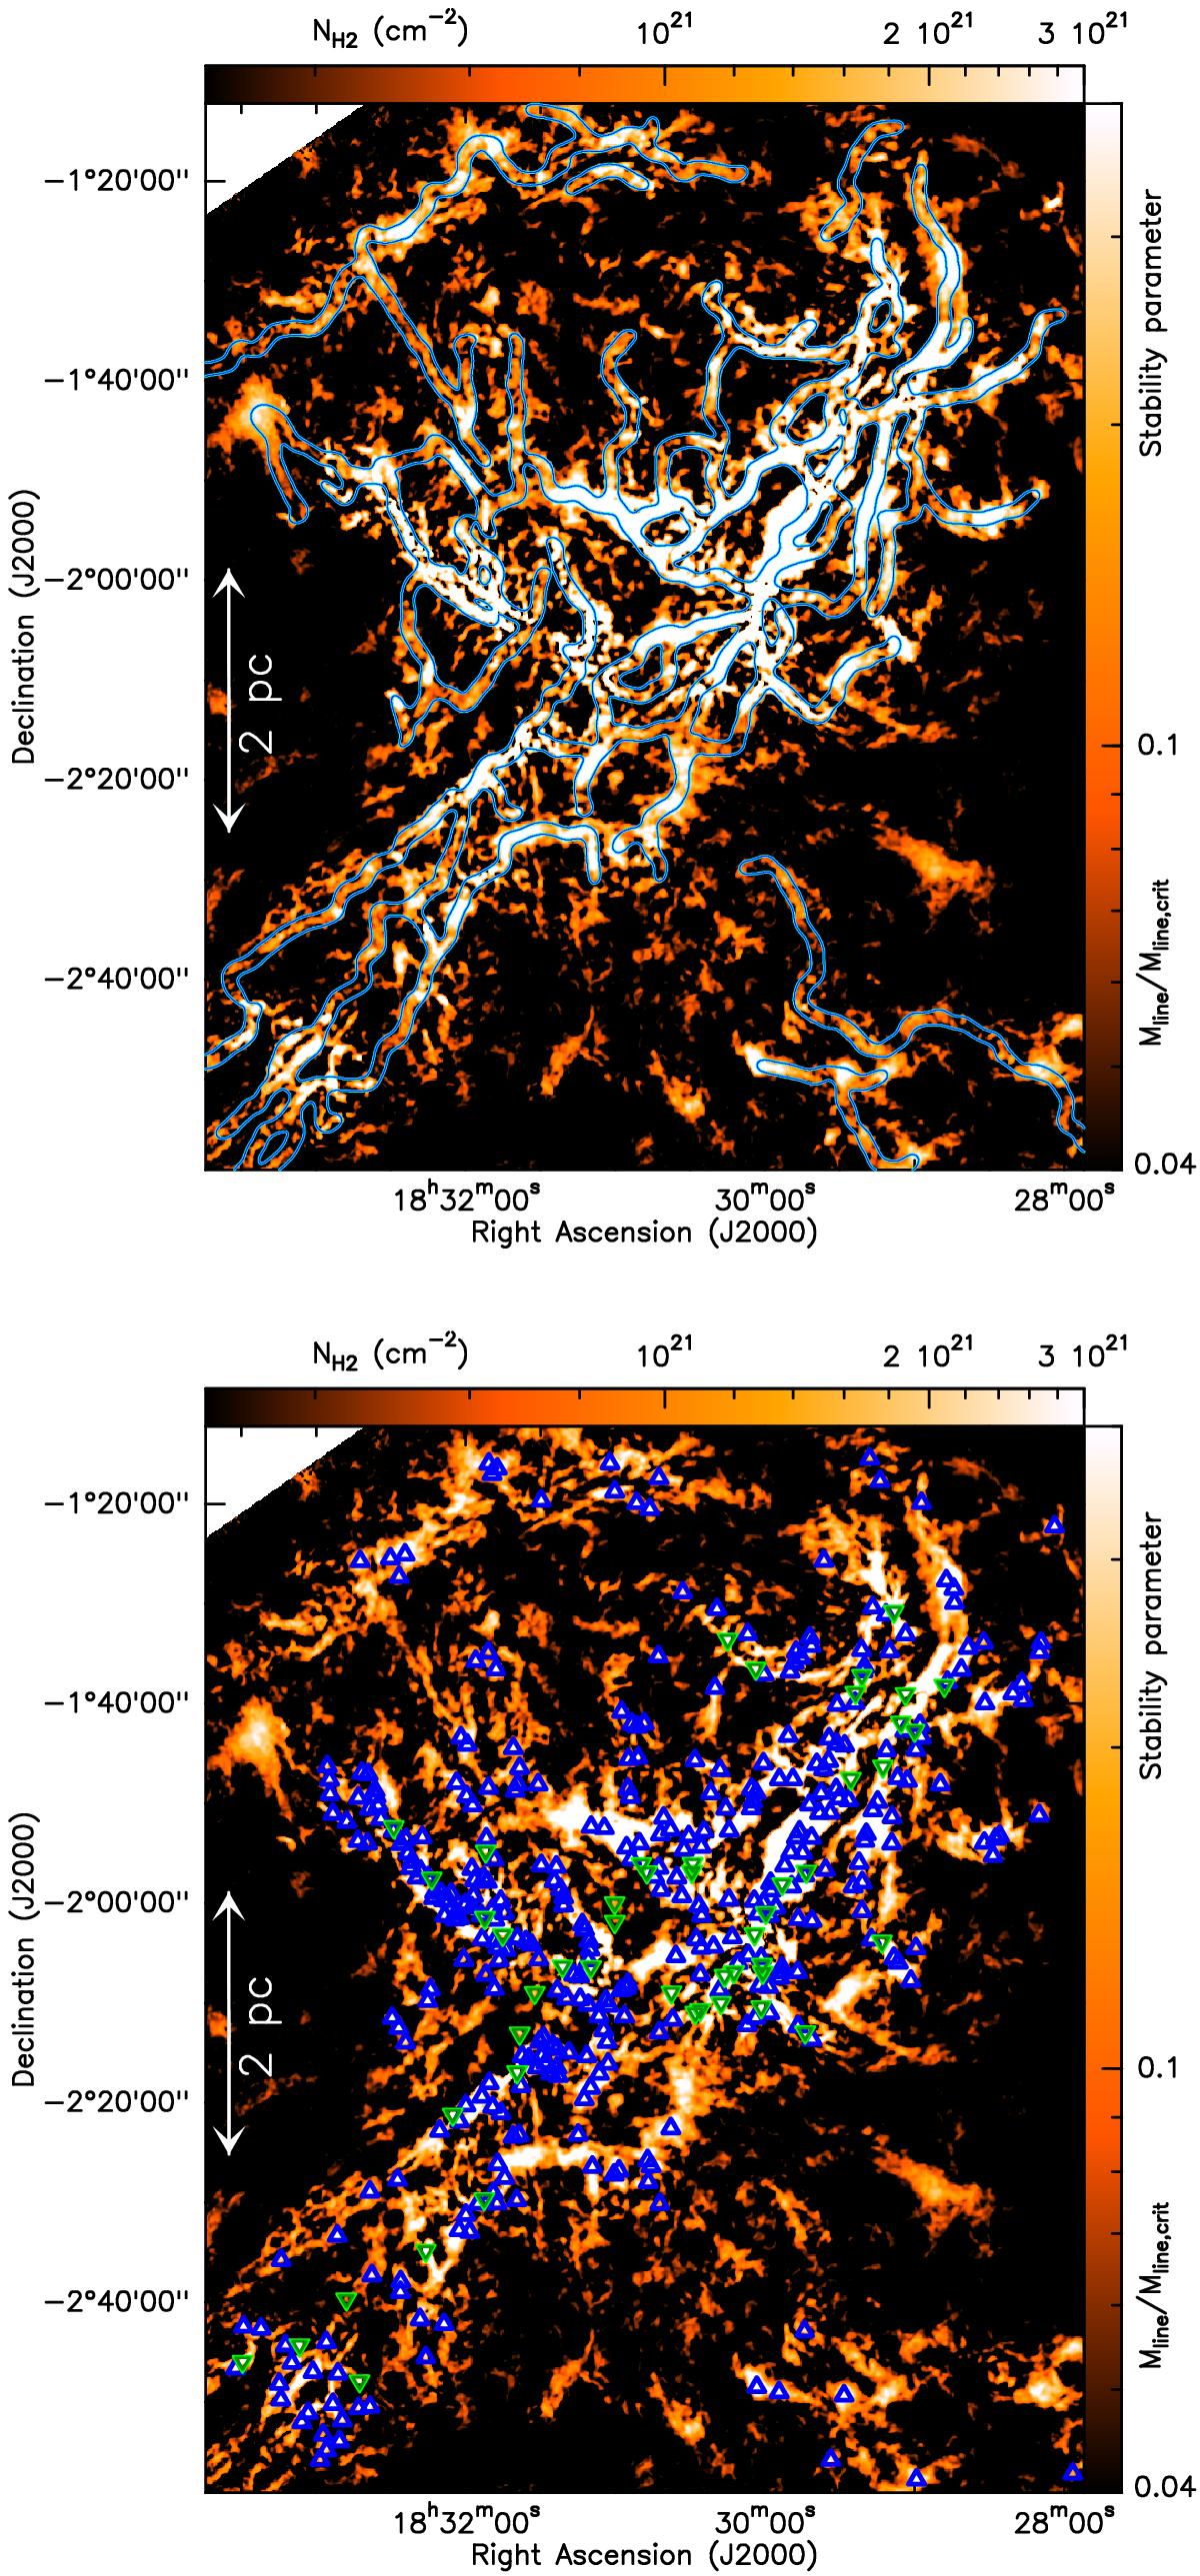
Upper: curvelet component (cf. Starck et al. 2003) of a portion of the Herschel high-resolution column density map shown in Fig. 1. Given the typical filament width of ~0.1 pc (Arzoumanian et al. 2011), this map is equivalent to a map of the mass per unit length along the filaments (cf. André et al. 2010), as indicated by the color bar on the right. The white areas highlight regions of the map where the filaments have a mass per unit length larger than half the critical value ![]() (cf. Inutsuka & Miyama 1997) and are thus likely to be gravitationally unstable (see Sect. 4.2 and Fig. 3). The contours overlaid in blue outline the 0.1 pc-wide footprints of the filaments traced with DisPerSE in Sect. 4.2 (cf. red contours in Fig. 13). Lower: same map as in the upper panel with the locations of candidate prestellar cores and protostellar cores overlaid as blue triangles and green triangles, respectively. (Color figure is available in the online version.)
(cf. Inutsuka & Miyama 1997) and are thus likely to be gravitationally unstable (see Sect. 4.2 and Fig. 3). The contours overlaid in blue outline the 0.1 pc-wide footprints of the filaments traced with DisPerSE in Sect. 4.2 (cf. red contours in Fig. 13). Lower: same map as in the upper panel with the locations of candidate prestellar cores and protostellar cores overlaid as blue triangles and green triangles, respectively. (Color figure is available in the online version.)
Current usage metrics show cumulative count of Article Views (full-text article views including HTML views, PDF and ePub downloads, according to the available data) and Abstracts Views on Vision4Press platform.
Data correspond to usage on the plateform after 2015. The current usage metrics is available 48-96 hours after online publication and is updated daily on week days.
Initial download of the metrics may take a while.