Fig. 13
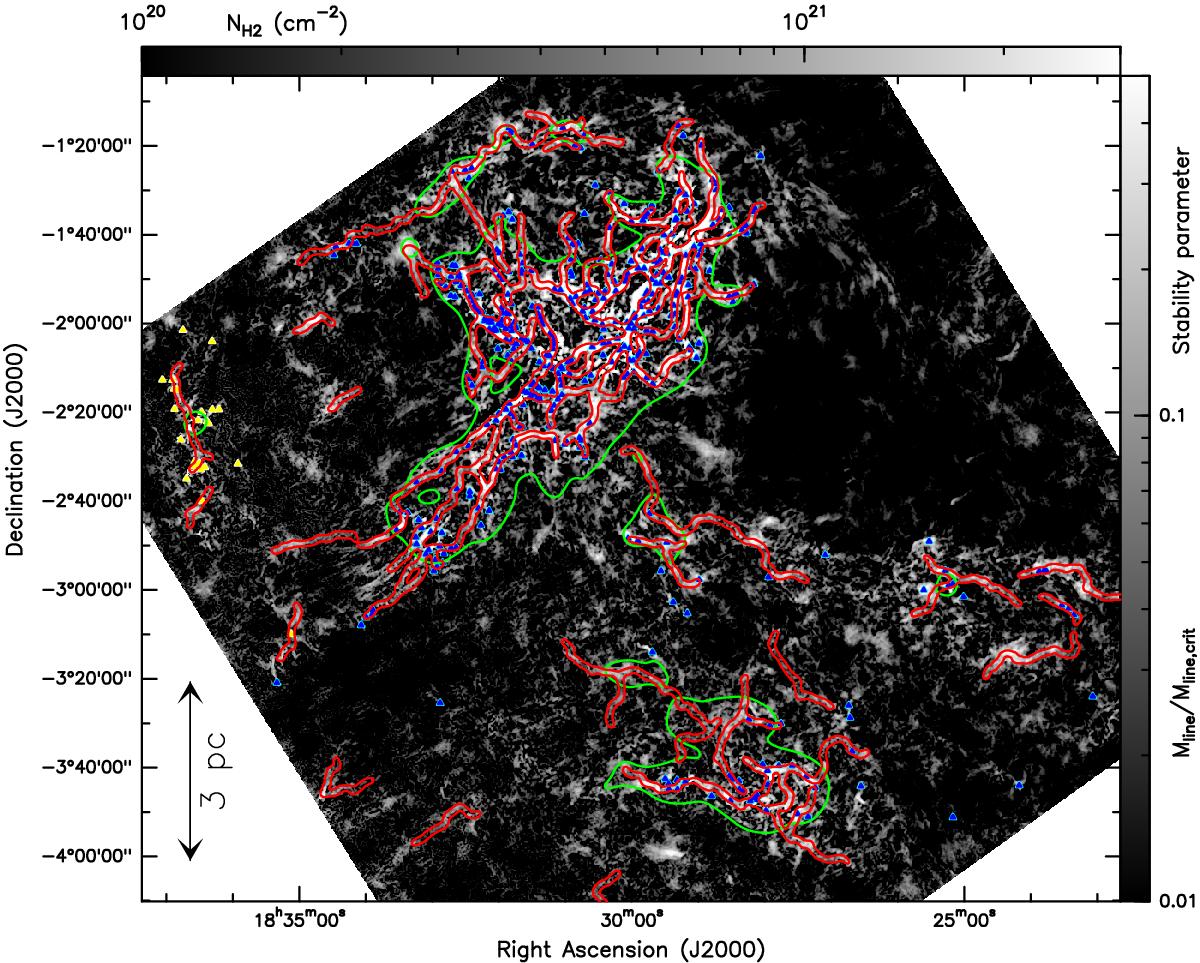
Comparison of the spatial distribution of the prestellar core population identified in Sect. 4.7 using getsources (blue triangles) with the footprints of all the filaments traced with DisPerSE (red contours), both overlaid on the curvelet component of the high-resolution column density map (cf. Fig. 3). The gray scale corresponds to the color scale of Fig. 3. The red contours outline 0.1 pc–wide footprints around the crests of filaments. The green contours correspond to AV = 7 in the column density map smoothed to a resolution of 5′. (Color figure is available in the online version.)
Current usage metrics show cumulative count of Article Views (full-text article views including HTML views, PDF and ePub downloads, according to the available data) and Abstracts Views on Vision4Press platform.
Data correspond to usage on the plateform after 2015. The current usage metrics is available 48-96 hours after online publication and is updated daily on week days.
Initial download of the metrics may take a while.