Fig. 11
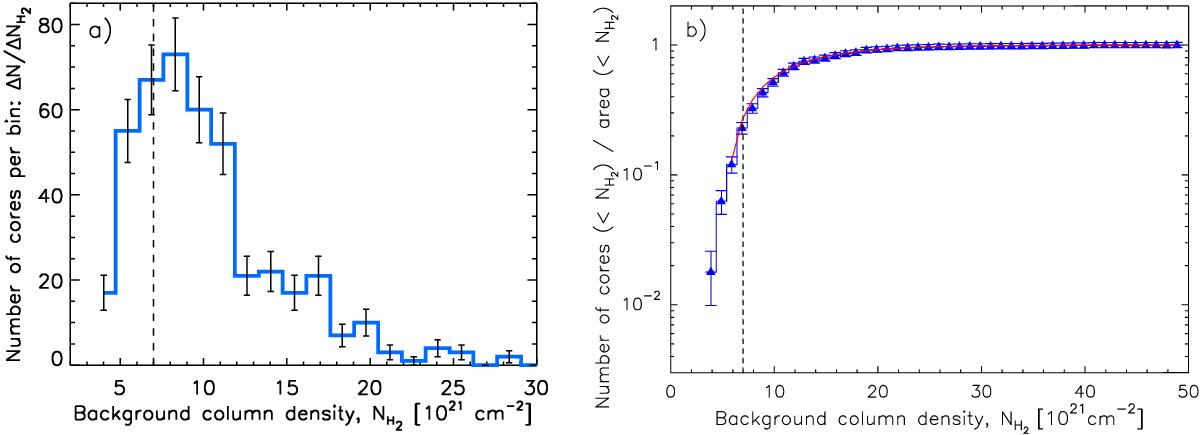
a) Distribution of background cloud column densities for the population of 446 candidate prestellar cores identified with Herschel in the whole Aquila field. The vertical dashed line marks a fiducial threshold at an equivalent visual extinction level ![]() mag (cf. Heiderman et al. 2010; Lada et al. 2010; André et al. 2010, 2014). b) Normalized “probability” of finding a Herschel prestellar core as a function of background column density (blue histogram with error bars), obtained by dividing the number of prestellar cores detected with Herschel below a given background column density level by the total surface area covered by the HGBS survey below the same level. The red curve shows a simple fit of the form Pcore(AV) = 1 − exp(a × AV + b) with a = −0.17 and b = 0.86. The vertical dashed line marks
mag (cf. Heiderman et al. 2010; Lada et al. 2010; André et al. 2010, 2014). b) Normalized “probability” of finding a Herschel prestellar core as a function of background column density (blue histogram with error bars), obtained by dividing the number of prestellar cores detected with Herschel below a given background column density level by the total surface area covered by the HGBS survey below the same level. The red curve shows a simple fit of the form Pcore(AV) = 1 − exp(a × AV + b) with a = −0.17 and b = 0.86. The vertical dashed line marks ![]() mag as in the left panel. (Color figure is available in the online version.)
mag as in the left panel. (Color figure is available in the online version.)
Current usage metrics show cumulative count of Article Views (full-text article views including HTML views, PDF and ePub downloads, according to the available data) and Abstracts Views on Vision4Press platform.
Data correspond to usage on the plateform after 2015. The current usage metrics is available 48-96 hours after online publication and is updated daily on week days.
Initial download of the metrics may take a while.