Fig. 10
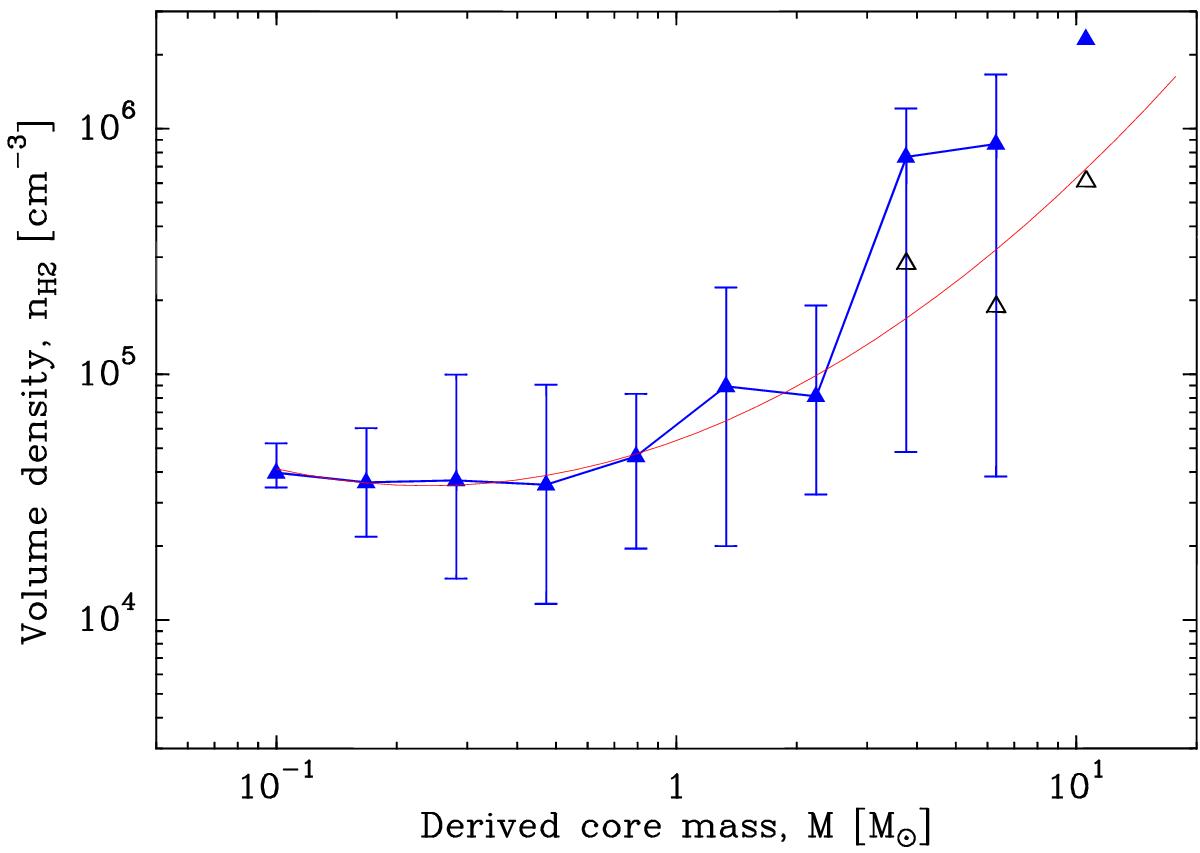
Average volume density versus observed core mass for the sample of 446 candidate prestellar cores. The blue solid triangles mark the median deconvolved volume density for each mass bin. (For comparison, the black open triangles show the median 36.3′′-beam-averaged densities for the upper three mass bins.) The error bars correspond to the interquartile range of densities in each mass bin. The data points become very uncertain at the high-mass end due to the small number of cores in the higher mass bins (see core mass function in Fig. 16 below). (No interquartile range can be plotted for the last bin which contains only two cores.) Note the weak, but significant, correlation between core density and core mass above ~2–3M⊙. The red curve represents a parabolic fit to the data points. (Color figure is available in the online version.)
Current usage metrics show cumulative count of Article Views (full-text article views including HTML views, PDF and ePub downloads, according to the available data) and Abstracts Views on Vision4Press platform.
Data correspond to usage on the plateform after 2015. The current usage metrics is available 48-96 hours after online publication and is updated daily on week days.
Initial download of the metrics may take a while.