Fig. 1
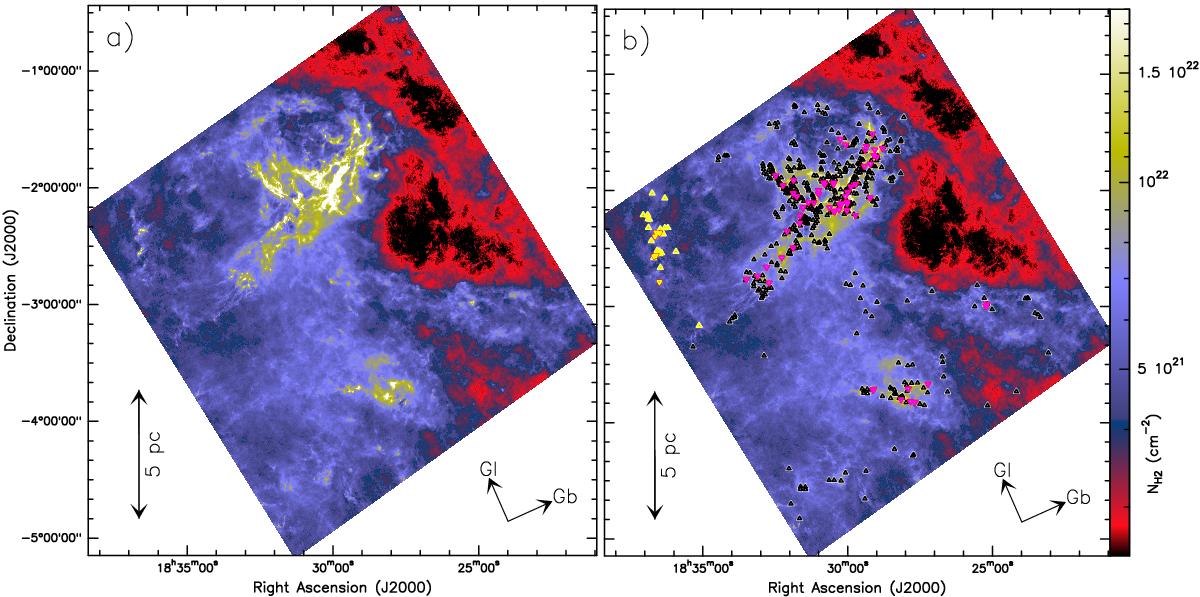
a) H2 column density map of the Aquila region at 18.2″ angular resolution, as derived from HGBS data using the method described in Sect. 4.1. b) Same map as in the left panel with the positions of the 446 candidate prestellar cores and 58 protostellar cores identified in the Herschel images with getsources (see Sects. 4.4 and 4.5) shown as black and magenta triangles, respectively. Yellow triangles locate additional prestellar and protostellar cores which were excluded from the analysis and discussion of this paper, due to likely contamination by more distant objects belonging to background CO clouds at significantly higher LSR velocities than the bulk of the Aquila complex (cf. Sect. 4.3). The orientation of the galactic coordinate axes is indicated at the lower right of each panel. The lower left edge of the map is oriented almost parallel to the galactic longitude axis at Gb ~ 2° above the Galactic plane. (Color figure is available in the online version.)
Current usage metrics show cumulative count of Article Views (full-text article views including HTML views, PDF and ePub downloads, according to the available data) and Abstracts Views on Vision4Press platform.
Data correspond to usage on the plateform after 2015. The current usage metrics is available 48-96 hours after online publication and is updated daily on week days.
Initial download of the metrics may take a while.