Open Access
Fig. 13
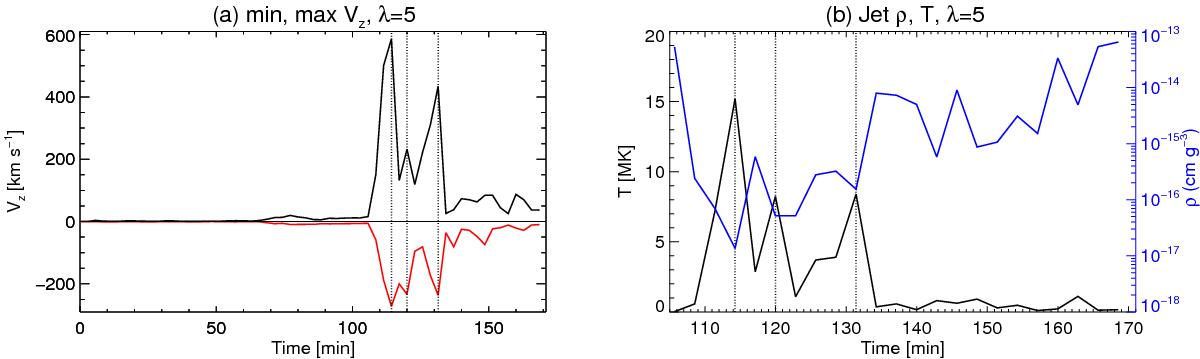
a) Temporal evolution of maximum (black) and minimum (red) Vz above the photosphere. The vertical dashed lines correspond to the plasma ejections at t = 114, 120, 132 min. b) Maximum temperature and density around the locations of maximum Vz.
Current usage metrics show cumulative count of Article Views (full-text article views including HTML views, PDF and ePub downloads, according to the available data) and Abstracts Views on Vision4Press platform.
Data correspond to usage on the plateform after 2015. The current usage metrics is available 48-96 hours after online publication and is updated daily on week days.
Initial download of the metrics may take a while.