Fig. 7
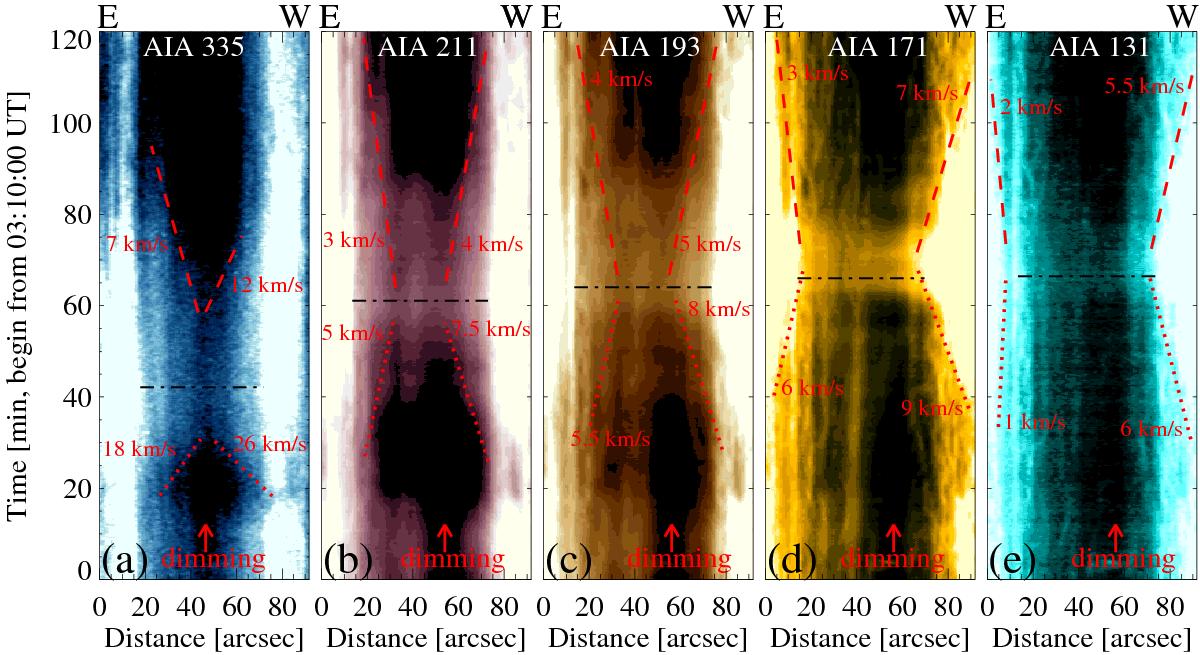
Proper motions along the loop. Similar to Fig. 4, but along the EW direction in the black rectangles in Loop 1 in Figs. 1c–g. The red dotted and dashed lines indicate upward and downward proper motions near the loop footpoints. The respective mean velocities are denoted by the numbers in the plots. The black dash-dotted lines indicate when the loop first becomes visible in the respective channel (same times as in Fig. 2). E and W are the same as in Fig. 1.
Current usage metrics show cumulative count of Article Views (full-text article views including HTML views, PDF and ePub downloads, according to the available data) and Abstracts Views on Vision4Press platform.
Data correspond to usage on the plateform after 2015. The current usage metrics is available 48-96 hours after online publication and is updated daily on week days.
Initial download of the metrics may take a while.