Fig. 4
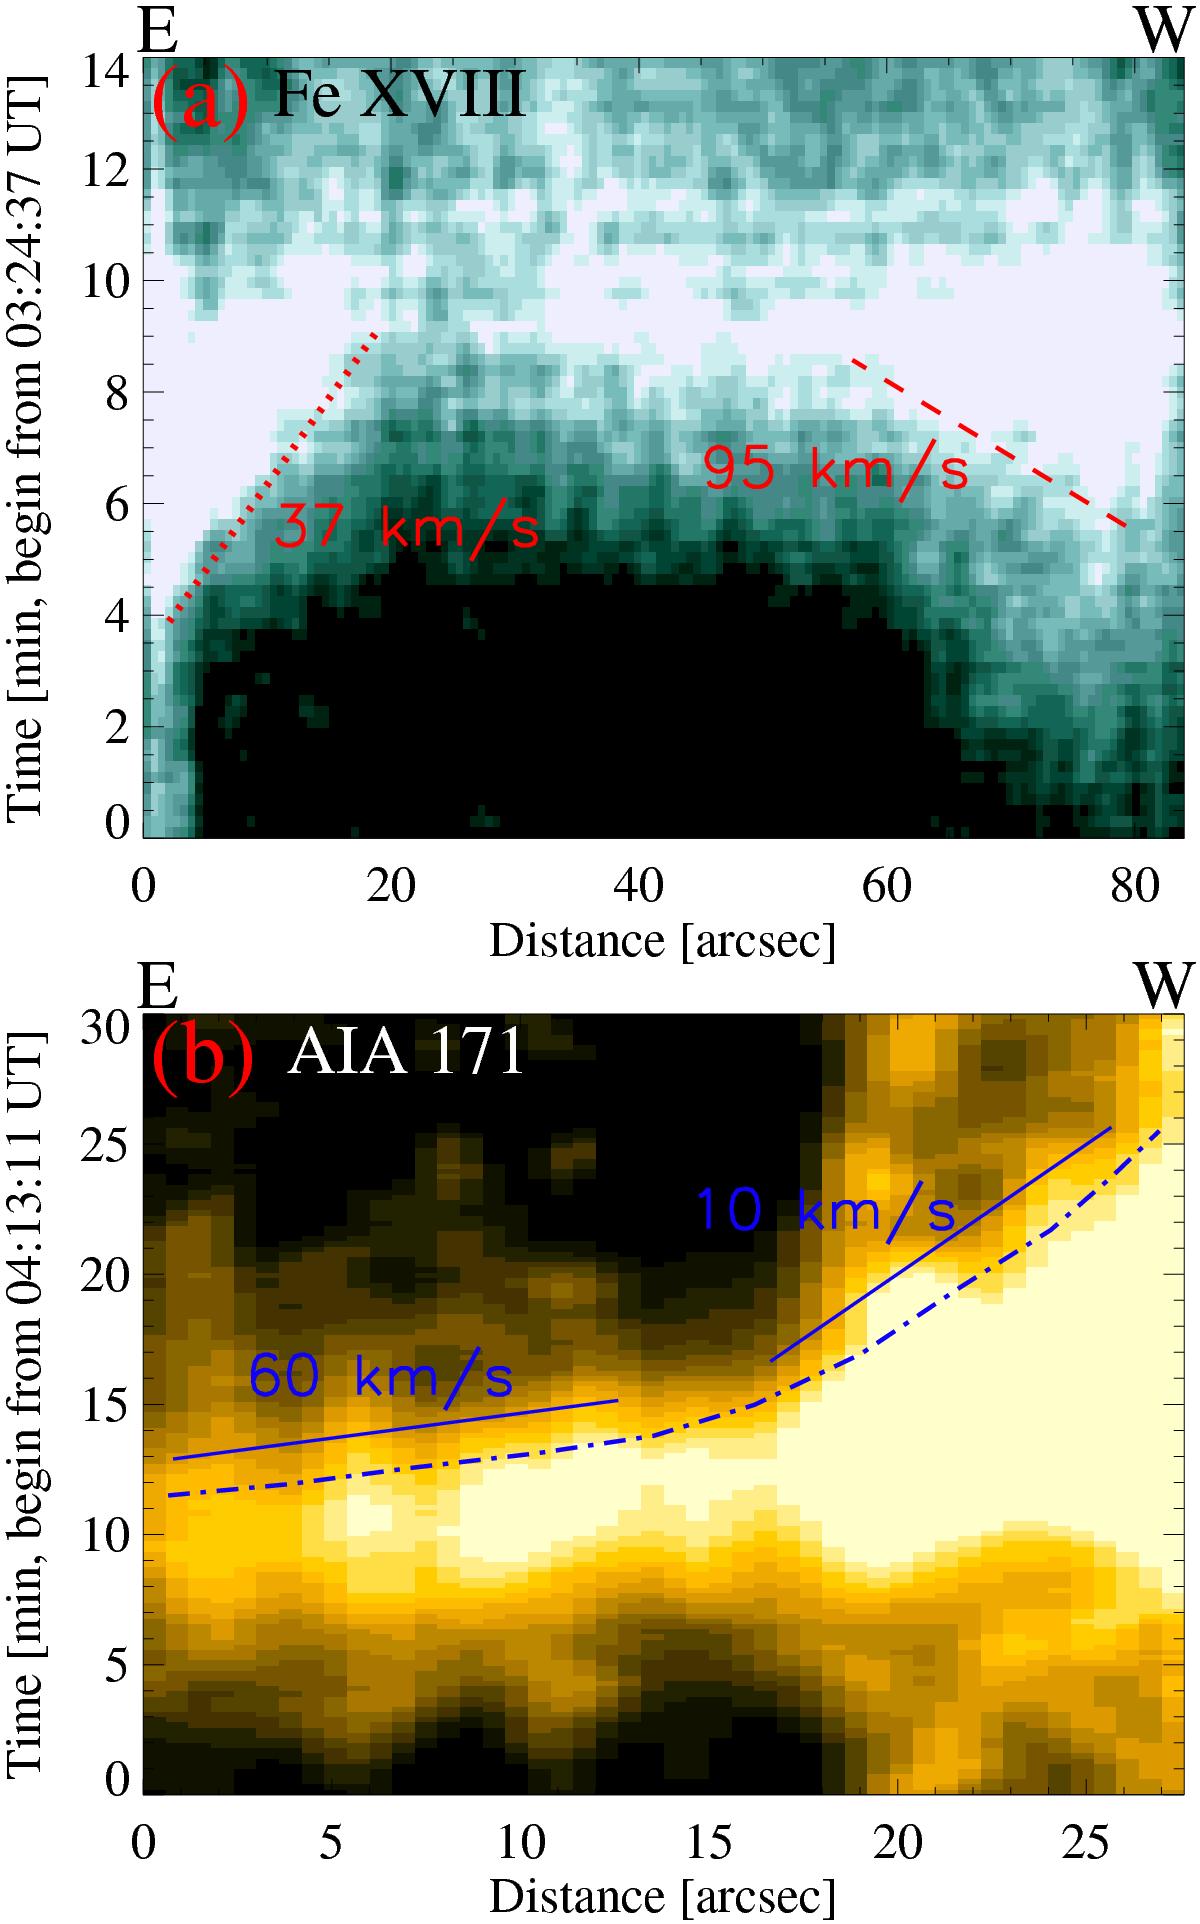
Proper motions along the loops. The panels show the space-time plots of the Fe XVIII a) and AIA 171 Å b) images along the direction EW in the red rectangle in Fig. 1a and the red line EW in Fig. 1f. In contrast to Fig. 3, here the distance is along the loop. The red dotted and dashed lines in a) and the blue dash-dotted and solid lines in b) indicate the proper motions. The mean speeds are denoted by the numbers in the plots. E and W are the same as in Fig. 1.
Current usage metrics show cumulative count of Article Views (full-text article views including HTML views, PDF and ePub downloads, according to the available data) and Abstracts Views on Vision4Press platform.
Data correspond to usage on the plateform after 2015. The current usage metrics is available 48-96 hours after online publication and is updated daily on week days.
Initial download of the metrics may take a while.