Fig. 3
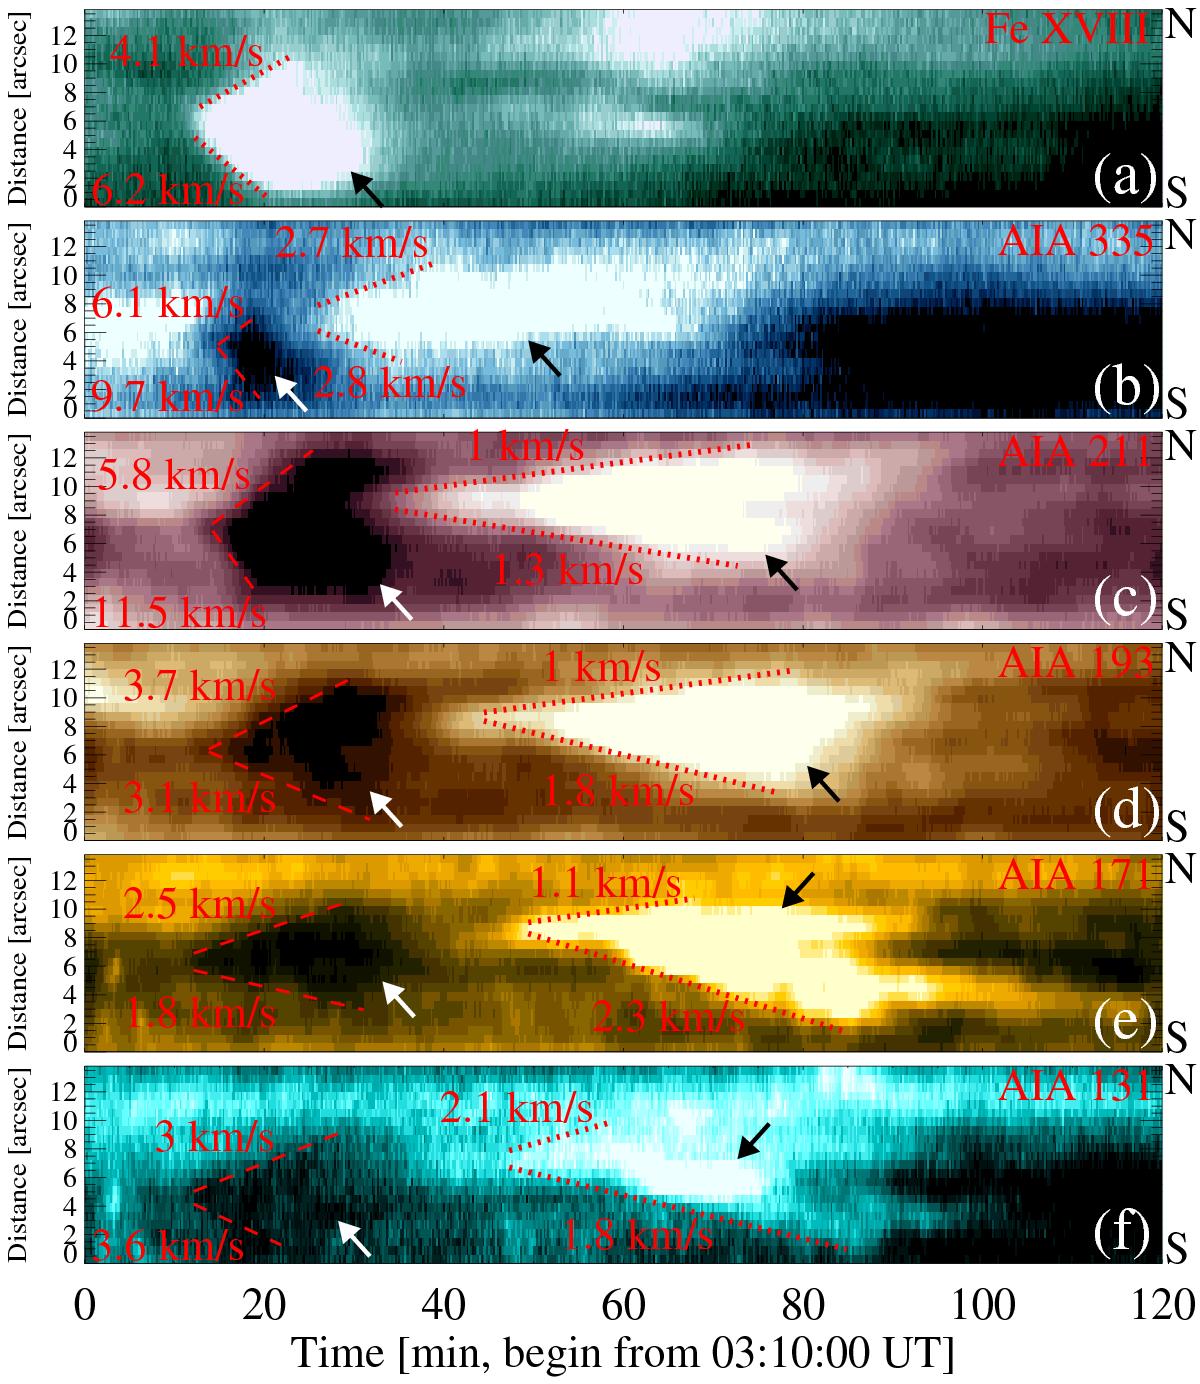
Brightening of Loop 1. The panels show the time-space diagrams along the NS direction in the white rectangles in Fig. 1. Here the distance is across the loop. The black arrows point to Loop 1, and the white arrows the dimming. The dotted lines outline the brightening expanding perpendicular to the loop, and the dashed lines the dimming as it expands. The respective mean velocities are denoted by the numbers in the plots. N and S are the same as in Fig. 1.
Current usage metrics show cumulative count of Article Views (full-text article views including HTML views, PDF and ePub downloads, according to the available data) and Abstracts Views on Vision4Press platform.
Data correspond to usage on the plateform after 2015. The current usage metrics is available 48-96 hours after online publication and is updated daily on week days.
Initial download of the metrics may take a while.