Fig. 1
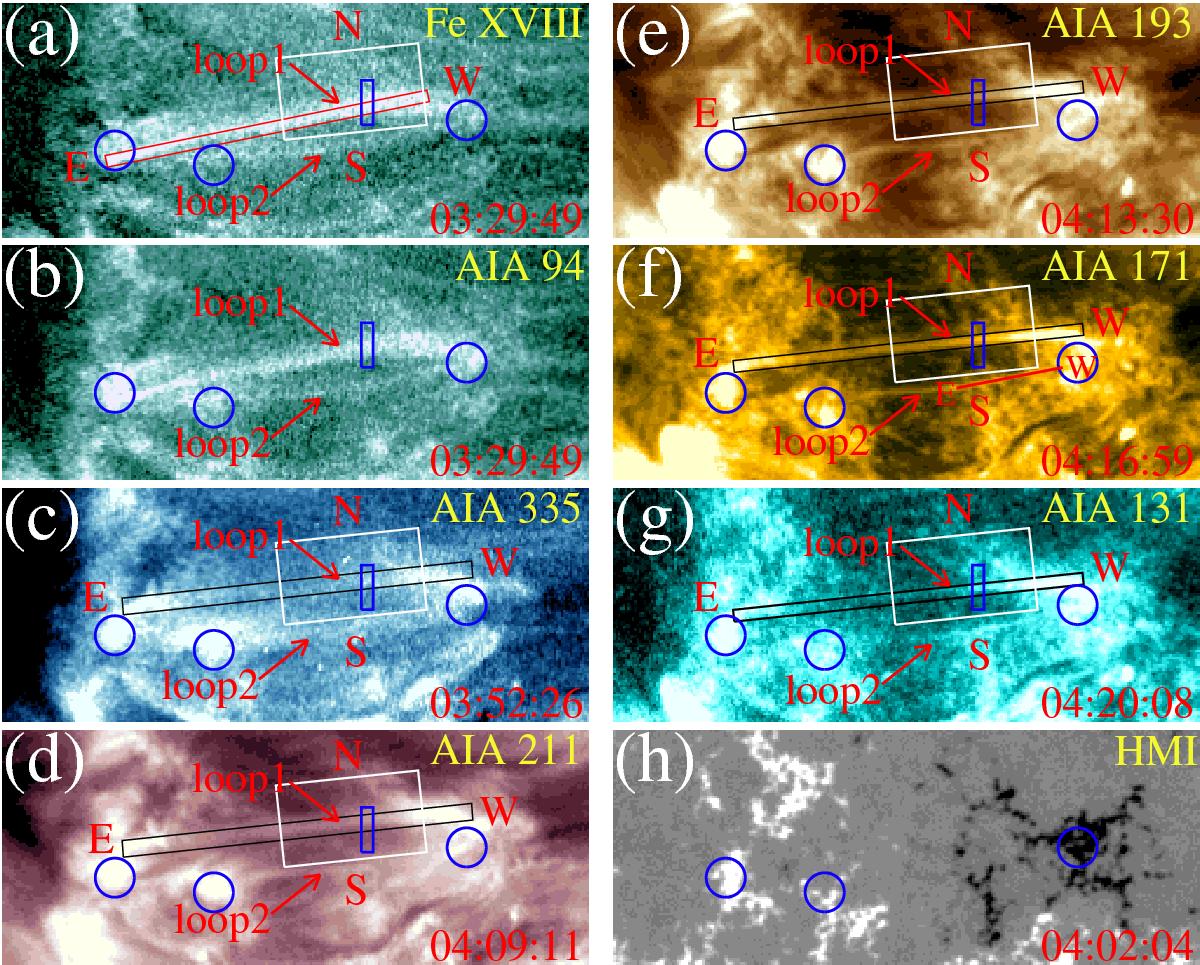
AIA/SDO extreme UV images and HMI/SDO magnetogram. Panels (a)–g)) display the loops as seen in Fe XVIII a), AIA 94 Å b), 335 Å c), 211 Å d), 193 Å e), 171 Å f), and 131 Å g). Panel h) shows the line-of-sight magnetogram. The Fe XVIII image is derived from the AIA images. (see Eq. (1)). The arrows point to the two loops investigated here. Each of the images (a)–g)) is shown when the loops become clearly visible in the respective band. The blue circles mark the footpoints of the loops, and the blue rectangles in (a)–g)) the regions for the lightcurves of the Loop 1, as shown in Figs. 2 and 5. The white rectangles NS in (a), c)–g)) indicate the positions for the time-space diagrams displayed in Fig. 3. The red rectangle EW in a), the red line EW in f), and the black rectangles EW in (c)–g)) show the positions for space-time diagrams displayed in Figs. 4a, b, and 7, respectively. E, W, N, and S separately denote the heliographic directions. The field of view (FOV) is 150″× 60″. (An animation of this figure is available online.)
Current usage metrics show cumulative count of Article Views (full-text article views including HTML views, PDF and ePub downloads, according to the available data) and Abstracts Views on Vision4Press platform.
Data correspond to usage on the plateform after 2015. The current usage metrics is available 48-96 hours after online publication and is updated daily on week days.
Initial download of the metrics may take a while.