| Issue |
A&A
Volume 583, November 2015
|
|
|---|---|---|
| Article Number | A95 | |
| Number of page(s) | 5 | |
| Section | Astrophysical processes | |
| DOI | https://doi.org/10.1051/0004-6361/201526877 | |
| Published online | 02 November 2015 | |
Nonlinear cosmic ray Galactic transport in the light of AMS-02 and Voyager data
1 Gran Sasso Science Institute (INFN), viale F. Crispi 7, 67100 L’Aquila, Italy
e-mail: This email address is being protected from spambots. You need JavaScript enabled to view it.
2 INAF/Osservatorio Astrofisico di Arcetri, Largo E. Fermi, 5 50125 Firenze, Italy
e-mail: This email address is being protected from spambots. You need JavaScript enabled to view it.
3 LAPTh, Univ. Savoie Mont Blanc, CNRS, BP 110, 74941 Annecy-le-Vieux, France
e-mail: This email address is being protected from spambots. You need JavaScript enabled to view it.
Received: 2 July 2015
Accepted: 22 August 2015
Abstract
Context. Features in the spectra of primary cosmic rays (CRs) provide invaluable information on the propagation of these particles in the Galaxy. In the rigidity region around a few hundred GV, these features have been measured in the proton and helium spectra by the PAMELA experiment and later confirmed with a higher significance by AMS-02. We investigate the implications of these data sets for the scenario in which CRs propagate under the action of self-generated waves.
Aims. We show that the recent data on the spectrum of protons and helium nuclei as collected with AMS-02 and Voyager are in very good agreement with the predictions of a model in which the transport of Galactic CRs is regulated by self-generated waves. We also study the implications of the scenario for the boron-to-carbon ratio: although a good overall agreement is found, at high energy we find marginal support for a (quasi) energy independent contribution from the grammage, which we argue may come from the sources themselves.
Methods. The transport equation for both primary and secondary nuclei is solved together with an equation for the evolution of the self-generated waves and a background of pre-existing waves. The solution for this system of nonlinear equations is found with an iterative method elaborated by the same authors in a previous work on this topic.
Results. A break in the spectra of all nuclei is found at a rigidity of a few hundred GV, as a result of a transition from self-generated waves to pre-existing waves with a Kolmogorov power spectrum. Neither the slope of the diffusion coefficient, nor its normalization are free parameters. Moreover, at rigidities below a few GV, CRs are predicted to be advected with the self-generated waves at the local Alfvén speed. This effect, predicted in our previous work, provides an excellent fit to the Voyager data on the proton and helium spectra at low energies, providing additional support to the model.
Key words: astroparticle physics / cosmic rays
© ESO, 2015
1. Introduction
The transport of Galactic cosmic rays (CRs) is likely to be very complex as the structure of the large scale magnetic field is complicated and very poorly known, and the structures on small scales (resonant with the CR particles) are basically unknown. However, the fact that the diffusion paradigm seems to work can be considered as indirect evidence for the existence of such small scale turbulence. The origin of the power on small scales is also unknown. One contribution that seems likely, however, is the self-generation of perturbations from the CR current, which is proportional to the gradient of CRs, and that gradient, in turn, is due to the existence of the same scattering centers responsible for diffusion. This simple description is sufficient to emphasize the nonlinear nature of this process, which is qualitatively similar to what happens at supernova shocks, which are thought to be the main sources of Galactic CRs (see the recent review by Blasi 2013).
The coupling between CRs and background plasma, through the excitation of waves, may also lead to the launching of a Galactic wind (Breitschwerdt et al. 1991), which can considerably change the transport of Galactic CRs (Ptuskin et al. 1997). In addition to the self-generated waves, turbulence at larger spatial scales is generically expected and becomes important for scattering CRs of higher energies. This scenario, though in the absence of a CR induced wind, has been analyzed in detail by Blasi et al. (2012) and Aloisio & Blasi (2013), where the main implications were discussed. Blasi et al. (2012) calculated the spectrum of protons under the action of both the self-generated and pre-existing turbulence, and compared the results with the PAMELA data available at the time (Adriani 2011), where the first direct detection of a spectral break in proton and helium fluxes at few hundred GV was claimed. The first release of the data collected by AMS-02 (Haino 2013; Choutko 2013) did not confirm the existence of these spectral features and brought the investigation on this topic to an almost complete standstill, waiting for the resolution of the observational conundrum. Recently the AMS collaboration published the final analysis of the data on the proton spectrum (Aguilar et al. 2015), where a change of slope at few hundred GV is evident. At the present time, only preliminary results on the spectrum of helium and carbon nuclei are available (AMS-02 2015), but a similar break is visible at least in the helium data, while the carbon data are still inconclusive in this respect. Moreover, preliminary data on the B/C ratio have also been presented: the small statistical error bars up to high energies allow us to use this tool as a powerful indicator of the propagation of CRs through the Galaxy.
In addition to the AMS-02 data, the results of another invaluable experimental effort became available in the last few years. The Voyager spacecraft, launched in 1977, reached the termination shock and is now believed to be moving in the interstellar medium, unaffected by the solar wind (Stone et al. 2013). The Voyager is therefore providing us with the very first measurement of the interstellar spectra of protons and helium nuclei, which can be compared directly with the predictions of our models, rather than dealing with complex and uncertain recipes of solar modulation.
These recent developments revived the interest of the community and stimulated a new search for explanations of the spectral breaks. In this paper, we reconsider the model first put forward by Blasi et al. (2012) and Aloisio & Blasi (2013) and check it versus both the data of AMS-02 and Voyager. We find that the set of parameters that were previously used to fit the PAMELA data also lead to a good fit to the AMS-02 data concerning the proton and helium spectra. The rigidity where the spectral break occurs is predicted rather solidly by the model. In fact, the model predicts in a rather constrained manner both the normalization and the energy dependence of the diffusion coefficient at rigidities below a few hundred GV, where self-generation is important. At the same time, it also fixes the injection rate (for instance in SNR shocks) and hence the diffusion coefficient at high energies to reproduce the observed spectrum of CRs. Since both contributions are quite well constrained, so is the transition energy. The constrained nature of the model is also its main strength. As discussed above, the B/C ratio was presented by the AMS-02 collaboration only in a preliminary form (AMS-02 2015) and we only use this information to further check, at least visually, the viability of the model. The AMS data extend to unprecedented high energies and hence they provide us with much information about propagation. We find that the preliminary data on B/C are well fit with our model, although there is marginal evidence for some additional grammage with a harder energy dependence compared with the grammage accumulated throughout the Galaxy. The necessary grammage is compatible with that accumulated by CRs while being accelerated and advected in a typical SNR, and is consistent with being energy independent.
The paper is structured as follows: in Sect. 2 we summarize the essential aspects of the model put forward by Blasi et al. (2012) and Aloisio & Blasi (2013). In Sect. 3 we discuss the implications for the nuclear spectra and for the B/C ratio. We summarize in Sect. 4.
2. Self-generated versus pre-existing waves and CR transport
In a 1D model (infinite slab, only dependence from distance z above/below the plane retained), the transport equation for CR nuclei in its general form can be written as follows: ![Mathematical equation: \begin{eqnarray} &&-\frac{\partial}{\partial z} \left[D_{\alpha}(p) \frac{\partial f_{\alpha}}{\partial z}\right] + w\frac{\partial f_{\alpha}}{\partial z} -\frac{p}{3}\frac{\partial w}{\partial z}\frac{\partial f_{\alpha}}{\partial p}+\frac{\mu v(p) \sigma_{\alpha}}{m}\delta(z) f_{\alpha} \nonumber\\ &&+\frac{1}{p^{2}} \frac{\partial}{\partial p}\left[p^{2} \left(\frac{{\rm d}p}{{\rm d}t}\right)_{\alpha,{\rm ion}} f_{\alpha}\right] = \nonumber\\ && 2 h_{\rm d} q_{0,\alpha}(p) \delta(z) +\sum_{\alpha'\,>\,\alpha} \frac{\mu\, v(p) \sigma_{\alpha'\to\alpha}}{m}\delta(z) f_{\alpha'}, \label{eq:slab} \end{eqnarray}](/articles/aa/full_html/2015/11/aa26877-15/aa26877-15-eq2.png) (1)where we defined:
(1)where we defined: ![Mathematical equation: \begin{eqnarray} w(z)=v_{\rm A}\Theta(z)-v_{\rm A}\left[1 - \Theta(z) \right], \end{eqnarray}](/articles/aa/full_html/2015/11/aa26877-15/aa26877-15-eq3.png) (2)with Θ(z) the Heaviside function and the Alfvén speed vA = B0/
(2)with Θ(z) the Heaviside function and the Alfvén speed vA = B0/ km s-1 (B0 = 1μG and ni = 0.02 cm-3 are the magnetic field strength and gas density in the halo). In Eq. (1), σα is the spallation cross section of a nucleus of type α, μ is a grammage parameter fixed to 2.4 mg/cm2, and q0,α(p) is the rate of injection per unit volume in the disk of the Galaxy. Namely, since hd is the half-thickness of the (assumed infinitesimal) gaseous disk, and 2 hdq0,α is the rate of injection in the disk of the Galaxy per unit surface. The total cross section for spallation and the cross sections for the individual channels of spallation of a heavier element to a lighter element (σα′ → α) have been taken from Webber et al. (1990, 2003). As stressed above, for the sake of a meaningful comparison with data, it is important to take the stable isotopes of all elements into account. This is important for pure secondary elements, namely elements produced only through spallation, such as boron (B = 10B + 11B), and for nitrogen (N = 14N + 15N), which gets a significant secondary contribution from spallation of heavier nuclei, for carbon (C = 12C + 13C) and oxygen (O = 16O + 17O + 18O) see e.g. di Bernardo et al. (2010) and Evoli et al. (2008). Moreover, for simplicity we assume an instantaneous decay for isotopes whose lifetime is much shorter than their escape time from the Galaxy. This means that in the sum over α′ in the rhs of Eq. (1), we also consider the terms of the type σα′ → α′′fα′ being α′′ a nuclear specie that rapidly decays into α.
In our equations, v(p) = βc is the velocity of nuclei of type α having momentum p. Since the gas is assumed to be present only in the disk, and the ionization rate is proportional to the gas density, one can write the following: 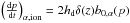 , where b0,α(p) contains the particle physics aspects of the process; see Strong & Moskalenko (1998) and references therein for a more detailed discussion of this term.
Following the procedure outlined by Aloisio & Blasi (2013) (Eqs. (3.3) to (3.5) of that paper), one can transform Eq. (1) in a modified weighted slab transport equation, i.e., ![Mathematical equation: \begin{eqnarray} &&\frac{I_{\alpha}(E)}{X_{\alpha}(E)} + \frac{\rm d}{{\rm d}E}\left\{\left[\left(\frac{{\rm d}E}{{\rm d}x}\right)_{\rm ad} + \left(\frac{{\rm d}E}{{\rm d}x}\right)_{{\rm ion},\alpha}\right] I_{\alpha}(E)\right\} + \frac{\sigma_{\alpha} I_{\alpha}(E)}{m} = \nonumber\\ &&2 h_{\rm d} \frac{A_{\alpha} p^{2} q_{0,\alpha}(p)}{\mu\, v} + \sum_{\alpha'\,>\,\alpha} \frac{I_{\alpha}(E)}{m}\sigma_{\alpha'\to\alpha}, \label{eq:slab2} \end{eqnarray}](/articles/aa/full_html/2015/11/aa26877-15/aa26877-15-eq34.png) (3)where Iα(E) is the flux of nuclei with kinetic energy per nucleon E for nuclei of type α, such that Iα(E)dE = vp2f0,α(p)dp. It is easy to show that Iα(E) = Aαp2f0,α(p), being Aα the atomic mass number of the nucleus. We also introduced the quantity
(3)where Iα(E) is the flux of nuclei with kinetic energy per nucleon E for nuclei of type α, such that Iα(E)dE = vp2f0,α(p)dp. It is easy to show that Iα(E) = Aαp2f0,α(p), being Aα the atomic mass number of the nucleus. We also introduced the quantity ![Mathematical equation: \begin{eqnarray} X_{\alpha}(E) = \frac{\mu \,v}{2 v_{\rm A}} \left[1-\exp\left(-\frac{v_{\rm A}}{D_{\alpha}}H\right)\right] , \end{eqnarray}](/articles/aa/full_html/2015/11/aa26877-15/aa26877-15-eq40.png) (4)which represents the grammage for nuclei of type α with kinetic energy per nucleon E, while
(4)which represents the grammage for nuclei of type α with kinetic energy per nucleon E, while 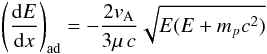 (5)is the rate of adiabatic energy losses due to advection.
The diffusion coefficient relevant for a nucleus α can be written as ![Mathematical equation: \begin{eqnarray} D_{\alpha} (p) = \frac{1}{3} \frac{p\,c}{Z_\alpha eB_{0}} v(p) \left[\frac{1}{k\ W(k)} \right]_{k\,=\,Z_{\alpha} e B_{0}/{\rm pc}}, \label{eq:diff} \end{eqnarray}](/articles/aa/full_html/2015/11/aa26877-15/aa26877-15-eq42.png) (6)where W(k) is the power spectrum of waves at the resonant wavenumber k = ZαeB0/pc, Z being the nuclear electric charge. The nonlinearity of the problem is evident here. The diffusion coefficient for each nuclear species depends on all other nuclei through the wave power W(k), but the spectra are in turn determined by the relevant diffusion coefficient. The problem can be written in a closed form, though in an implicit way, using the transport equation for each nucleus, Eq. (3), and writing the evolution equation for the waves (Miller & Roberts 1995)
(6)where W(k) is the power spectrum of waves at the resonant wavenumber k = ZαeB0/pc, Z being the nuclear electric charge. The nonlinearity of the problem is evident here. The diffusion coefficient for each nuclear species depends on all other nuclei through the wave power W(k), but the spectra are in turn determined by the relevant diffusion coefficient. The problem can be written in a closed form, though in an implicit way, using the transport equation for each nucleus, Eq. (3), and writing the evolution equation for the waves (Miller & Roberts 1995) ![Mathematical equation: \begin{eqnarray} \frac{\partial}{\partial k}\left[D_{kk} \frac{\partial W}{\partial k}\right] + \Gamma_{\rm CR}W = q_{W}(k), \label{eq:cascade} \end{eqnarray}](/articles/aa/full_html/2015/11/aa26877-15/aa26877-15-eq46.png) (7)where qW(k) is the injection term of waves with wavenumber k and Dkk = CKvAk7/2W(k)1/2 is the diffusion coefficient of waves in k space for a Kolmogorov phenomenology and CK ≈ 0.052 is a numerical coefficient. In the present calculations, we assume that waves are only injected on a scale lc ~ 50–100 pc, for instance, by supernova explosions. This means that qW(k) ∝ δ(k−1 /lc). The level of pre-existing turbulence is normalized to the total power
(7)where qW(k) is the injection term of waves with wavenumber k and Dkk = CKvAk7/2W(k)1/2 is the diffusion coefficient of waves in k space for a Kolmogorov phenomenology and CK ≈ 0.052 is a numerical coefficient. In the present calculations, we assume that waves are only injected on a scale lc ~ 50–100 pc, for instance, by supernova explosions. This means that qW(k) ∝ δ(k−1 /lc). The level of pre-existing turbulence is normalized to the total power 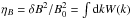 . Strictly speaking the wavenumber that appears in this formalism is the one in the direction parallel to that of the ordered magnetic field. In a more realistic situation in which most power is on large spatial scales, the role of the ordered field is probably played by the local magnetic field on the largest scale.
The term ΓCRW in Eq. (7) describes the generation of wave power through CR induced streaming instability, with a growth rate (Skilling 1975) ![Mathematical equation: \begin{eqnarray} \Gamma_{\rm cr}(k)=\frac{16 \pi^{2}}{3} \frac{v_{\rm A}}{k\,W(k) B_{0}^{2}} \sum_{\alpha} \left[p^{4} v(p) \frac{\partial f_{\alpha}}{\partial z}\right]_{p\,=\,Z_{\alpha} e B_{0}/kc} , \label{eq:gammacr} \end{eqnarray}](/articles/aa/full_html/2015/11/aa26877-15/aa26877-15-eq55.png) (8)where α is the index labeling nuclei of different types. All nuclei, including all stable isotopes for a given value of charge, are included in the calculations. As discussed in previous literature, it is very important to compute the diffusion coefficient properly, and thus for a meaningful comparison with the flux spectra and secondary to primary ratios, notably B/C. The growth rate, written as in Eq. (8), refers to waves with wavenumber k along the ordered magnetic field. It is basically impossible to generalize the growth rate to a more realistic field geometry by operating in the context of quasi-linear theory, therefore we use here this expression but keep its limitations in mind.
(8)where α is the index labeling nuclei of different types. All nuclei, including all stable isotopes for a given value of charge, are included in the calculations. As discussed in previous literature, it is very important to compute the diffusion coefficient properly, and thus for a meaningful comparison with the flux spectra and secondary to primary ratios, notably B/C. The growth rate, written as in Eq. (8), refers to waves with wavenumber k along the ordered magnetic field. It is basically impossible to generalize the growth rate to a more realistic field geometry by operating in the context of quasi-linear theory, therefore we use here this expression but keep its limitations in mind.
The solution of Eq. (7) can be written in an implicit form, i.e., ![Mathematical equation: \begin{eqnarray} W(k) \!=\! \left[W_0^{3/2}\!\left (\frac{k}{k_0}\right )^{-5/2} \!+\! \frac{3}{2 C_{\rm K}v_{\rm A}}\!\!\int_k^\infty\frac{{\rm d}k'}{k'^{1/2}}\!\!\int_{k_0}^{k'} {\rm d}\tilde k \Gamma_{\rm CR}(\tilde k) W(\tilde k) \right]^{\frac{2}{3}}\! \!, \label{eq:waves} \end{eqnarray}](/articles/aa/full_html/2015/11/aa26877-15/aa26877-15-eq56.png) (9)where k0 = 1 /lc. The two terms in Eq. (9) refer to the pre-existing magnetic turbulence and the CR induced turbulence, respectively. In the limit in which there are no CRs (or CRs do not play an appreciable role) one finds the standard Kolmogorov wave spectrum,
(9)where k0 = 1 /lc. The two terms in Eq. (9) refer to the pre-existing magnetic turbulence and the CR induced turbulence, respectively. In the limit in which there are no CRs (or CRs do not play an appreciable role) one finds the standard Kolmogorov wave spectrum,  , normalized, as discussed above, to the total power W0 = (2/3)lcηB.
The equations for the waves and for CR transport are solved together in an iterative way, so as to return the spectra of particles and the diffusion coefficient for each nuclear species and the associated grammage. The procedure is started by choosing guess injection factors for each type of nuclei, and a guess for the diffusion coefficient, which is assumed to coincide with that predicted by quasi-linear theory in the presence of a background turbulence. The first iteration returns the spectra of each nuclear species and a spectrum of waves, which can now be used to calculate the diffusion coefficient self-consistently. The procedure is repeated until convergence, which is typically reached in a few steps, and the resulting fluxes and ratios are compared with available data. This allows us to renormalize the injection rates and restart the whole procedure, which is repeated until a satisfactory fit is achieved. Since the fluxes of individual nuclei affect the grammage through the rate of excitation of streaming instability and viceversa the grammage affects the fluxes, the procedure is not trivial.
3. Results
The main evidence for a transition from self-generated waves to pre-existing turbulence can be searched for in the spectra of the light elements, protons, and helium nuclei. A spectral break was in fact found by the PAMELA experiment (Adriani 2011) in both spectra and later confirmed by AMS-02, although thus far only the results of AMS concerning protons have been published (Aguilar et al. 2015), while a preliminary version of the spectrum of helium has been presented (AMS-02 2015). The spectra of both elements were also measured by the Voyager (Stone et al. 2013) outside the heliosphere, so as to make this the first measurement in human history of the CR spectra in the interstellar medium. These are very important results in that they also allow us to refine our understanding of the effects of solar modulation (Potgieter 2013).
 |
Fig. 1 Spectrum of protons measured by Voyager (blue empty circles), AMS-02 (black filled circles; Aguilar et al. 2015), PAMELA (green empty squares; Adriani 2011) and CREAM (blue filled squares; Yoon et al. 2011), compared with the prediction of our calculations (lines). The solid line is the flux at the Earth after the correction due to solar modulation, while the dashed line is the spectrum in the ISM. |
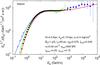 |
Fig. 2 Spectrum of He nuclei according to preliminary measurements of AMS-02 (black filled circles), as measured by Voyager (blue empty circles), PAMELA (green empty squares), and CREAM (blue filled squares), compared with the prediction of our calculations (lines). The solid line is the flux at the Earth after the correction due to solar modulation, while the dashed line is the spectrum in the ISM. |
The spectrum of protons and helium nuclei as calculated in this paper is shown in Figs. 1 and 2, respectively. The solid lines indicate the spectra at the Earth, namely after solar modulation modeled using the force-free approximation (Gleeson 1968), while the dashed lines are the spectra in the ISM. The data points are the spectra measured by the Voyager (empty circles; Stone et al. 2013), AMS-02 (filled circles; Aguilar et al. 2015), PAMELA (empty squares; Adriani 2011), and CREAM (filled squares; Yoon et al. 2011). Figures 1 and 2 show several interesting aspects: 1) both the spectra of protons and helium nuclei show a pronounced change of slope at few hundred GeV/n, where self-generation of waves becomes less important than pre-existing turbulence (in fact, the change of slope takes place in rigidity). 2) We confirm that injecting He with a slightly harder spectrum with respect to protons (p-4.15 versus p-4.2) improves the fit to the data. 3) The spectra calculated to optimize the fit to the AMS-02 and PAMELA data is in excellent agreement with the Voyager data (see dashed lines). This is not trivial: in our model, at sufficiently low energies (below ~10 GeV/n), particle transport is dominated by advection (at the Alfén speed) with self-generated waves rather than diffusion. This reflects into a weak energy dependence of the propagated spectra, which is exactly what Voyager measured (see also Potgieter 2013). 4) At low energies, the agreement of the predicted spectra with those measured by Voyager is actually better than the agreement with the modulated spectra, as observed with AMS–02; this suggests that the prescriptions used to describe solar modulation are probably somewhat oversimplified, either when applied to data collected over extended periods of time, when the effective solar potential may change appreciably, or because of intrinsic limitations of the force-field approximation.
For each heavier nucleus, we assume the same injected spectral shape in rigidity as for helium, keeping as only free parameter the normalization, chosen to match the data. In Fig. 3 we illustrate the prediction for carbon nuclei (which is also a needed ingredient to compute the B/C ratio), compared with data by PAMELA and CREAM, as well as preliminary data by AMS-02. The free normalization is chosen to match the AMS-02 data more closely. Clearly, the phenomenon of transition from self-generated to pre-existing waves manifests itself in the transport of all nuclei, hence, we should expect a spectral break at the same rigidity as for helium and protons. This prediction appears currently in agreement with carbon spectrum observations, although it is hard to judge to what extent a break is present in AMS-02 data alone, given the growing error bars and the limited dynamical range at high energy. A break would appear more prominent if one were to combine PAMELA and CREAM data, which seem to differ from AMS-02 data in the 10 to ~200 GeV/n range beyond the reported errors. The forthcoming AMS-02 publication of nuclear fluxes should definitely help clarify the situation.
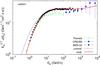 |
Fig. 3 Spectrum of C nuclei as measured by CREAM (blue squares), PAMELA (green empty squares), and according to preliminary measurements of AMS-02 (black circles), compared with the prediction of our calculations (lines). The solid line is the flux at the Earth after the correction due to solar modulation, while the dashed line is the spectrum in the ISM. |
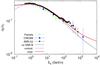 |
Fig. 4 B/C ratio as measured by CREAM (blue squares), PAMELA (green empty squares), and according to preliminary measurements of AMS-02 (black circles). The black/bottom solid line is the prediction of our model, while the red/top line has been obtained by adding a source grammage of 0.15 g cm-2, close to that given by Eq. (10). |
In Fig. 4 we show the calculated B/C ratio (solid black line) as compared with data from CREAM (blue squares), PAMELA (green squares), and the still preliminary data from AMS-02 (black circles). Even if the injected carbon flux is normalized to the preliminary carbon data reported by AMS-02, the B/C ratio is still in satisfactory agreement with both PAMELA and CREAM data, as for our previous result (Aloisio & Blasi 2013). The B/C ratio also fits the AMS data up to ~100 GeV/n. At higher energy, the AMS-02 analysis seems to suggest a B/C ratio somewhat higher than our prediction. While its significance is uncertain, given the preliminary nature of AMS data, if this excess is interpreted as physical, it would suggest the presence of an additional contribution to the grammage traversed by CRs. The most straightforward possibility to account for such a grammage is that it may be due to the matter traversed by CRs while escaping the source, for instance, a SNR. The grammage due to confinement inside a SNR can be easily estimated as 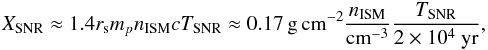 (10)where nISM is the density of the interstellar gas upstream of a SNR shock, rs = 4 is the compression factor at the shock, and TSNR is the duration of the SNR event (or better, the lifetime useful to confine particles up to E ~ TeV/n), assumed here to be of order 20 000 yr. The factor 1.4 in Eq. (10) has been introduced to account for the presence of elements heavier than hydrogen in the target. While Eq. (10) is only a rough estimate of the grammage at the source, in that several (in general energy dependent) factors may affect this estimate, at least it provides us with a reasonable benchmark value. The solid red curve in Fig. 4 shows the result of adding the grammage accumulated by CRs inside the source to that due to propagation in the Galaxy. It is clear by eye that the curve accounting for production at source fits better the AMS-02 data at high rigidity, while it is also compatible with the older CREAM data. The forthcoming publication by AMS-02 of the fluxes of nuclei and secondary to primary ratios should hopefully clarify the situation and provide more reliable discriminating power.
4. Summary and conclusions
One of the main implications of the transport theory of CRs in the Galaxy is that the spatial gradient developed due to the diffusive propagation of CRs (for instance, tuned to fit the B/C ratio) is such that the rate of growth of Alfvén waves cannot be neglected, and in fact at rigidity ≲200 GV the self-generated waves must play a dominant role. On the other hand, at higher rigidity the growth rate drops with respect to damping processes responsible for cascading of waves in wavenumber space. As shown by Blasi et al. (2012) and later by Aloisio & Blasi (2013), the transition between the two reflects in a change of slope in the spectra of primary elements, most notably protons and helium nuclei. Evidence in favor of this kind of break emerged first in nuclear spectra (Ahn 2010). Then, hints for something similar in proton and helium spectra were suggested by the need to reconcile high-energy data measured by CREAM (Yoon et al. 2011) with low-energy data, and, more recently, PAMELA (Adriani 2011) reported for the first time the detection of the transition in proton and helium nuclei. Finally, after contradictory early results presented by AMS-02 in 2013 (Haino 2013; Choutko 2013), this behavior for proton and helium has been confirmed by the AMS-02 collaboration (Aguilar et al. 2015, AMS-02 2015), albeit the publication only includes the proton spectrum, and the helium flux is still preliminary.
The results found in this paper can be summarized as follows: 1) both the proton and helium spectra show a pronounced change of slope at rigidity of a few hundred GV, which we interpret as the region where the self-generation of waves becomes less important than pre-existing turbulence. Our interpretation implies that a similar spectral break should also be present in the spectra of other primary nuclei (for instance carbon); current data are consistent with this prediction, although the uncertainties, both those of statistical nature and possibly others of systematic origin, do not enable a stringent quantitative test, so that as yet no final conclusion on this issue can be drawn. 2) The observed difference in spectral slope between He nuclei and protons should be attributed to differences at acceleration/injection, with the injection spectrum of He nuclei that must be somewhat harder (∝p-4.15) compared with the proton spectrum (∝p-4.2). No consensus on the theoretical explanation of this difference has emerged. Some models have been put forward, however, for instance involving different acceleration sites, as in the reverse shock of Ptuskin et al. (2013); the inhomogeneous chemical composition of the medium at the acceleration site (Ohira & Ioka 2011); or phenomena associated with the physics of the injection process (Malkov et al. 2012), such as that the more easily ionized hydrogen gets a greater contribution by older and weaker shocks (associated with steeper spectra; Drury 2011). 3) The spectra of protons and He nuclei predicted by our model automatically fit the low-energy Voyager data, which is remarkable because this suggests that the propagation of low-rigidity (≲10 GV) protons and He nuclei is dominated by advection with self-generated Alfvén waves, as was originally proposed by Blasi et al. (2012). 4) Data on secondaries or secondary to primary ratios pre-AMS are consistent with the picture above, as already shown in Aloisio & Blasi (2013), but as yet do not allow for a stringent test of this scenario. Preliminary AMS-02 data concerning the B/C ratio show greater potential for discriminating power and, if taken at face value, provide marginal evidence for an excess grammage at energy/nucleon ≳100 GeV/n. We speculated that this grammage may be traversed by CRs in the acceleration region. In fact, a quick estimate of the equivalent grammage in a typical SNR (putative source of CRs) compares exceptionally well with the grammage needed to reconcile the predicted and the observed one. A generic expectation is that at energies/nucleon of O(TeV/n), the contribution of production at the sources for so-called secondary species may become significant, as already noted in the past for other species such as antiprotons (Blasi & Serpico 2009). Needless to say, current B/C data presented by the AMS-02 collaboration are still preliminary and one should not overinterpret them, especially in the light of the challenging path that leads to the final establishment of the presence of changes of slope in the proton (and most likely also helium) spectrum. Yet, it is certainly true that secondary-to-primary ratios at the level of precision and dynamical range, which should be achievable by AMS-02, carry a substantial amount of information, as illustrated by our comparison. A more detailed reanalysis of our model will be certainly justified, once AMS-02 data concerning nuclear species (both primaries and secondary ones) are eventually published.
Acknowledgments
We thank the referee (G. Webb) for his valuable comments. P.B. is grateful to the members of the Arcetri High Energy Astrophysics Group for continuous insightful conversations. The work of P.B. was partially funded through Grant PRIN-INAF 2012. P.S. thanks the Arcetri Astrophysical Observatory, where part of this work was done, for very kind hospitality.
References
- Adriani, O., Barbarino, G. C., Bazilevskaya, G. A., et al. 2011, Science, 332, 69 [NASA ADS] [CrossRef] [PubMed] [Google Scholar]
- Aguilar, M., Aisa, D., Alpat, B., et al. 2015, Phys. Rev. Lett., 114, 171103 [CrossRef] [PubMed] [Google Scholar]
- Ahn, H. S., Allison, P., Bagliesi, M. G., et al. 2010, ApJ, 714, L89 [Google Scholar]
- AMS-02 Collaboration, Talks at the “AMS Days at CERN”, 15–17 april 2015, slides available at http://indico.cern.ch/event/381134/ [Google Scholar]
- Aloisio, R., & Blasi, P. 2013, J. Cosmol. Astropart. Phys., 07, 001 [NASA ADS] [CrossRef] [Google Scholar]
- Blasi, P. 2013, A&ARv, 21, 70 [Google Scholar]
- Blasi, P., & Serpico, P. D. 2009, Phys. Rev. Lett., 103, 081103 [CrossRef] [PubMed] [Google Scholar]
- Blasi, P., Amato, E., & Serpico, P. D. 2012, Phys. Rev. Lett., 109, 061101 [NASA ADS] [CrossRef] [PubMed] [Google Scholar]
- Breitschwerdt, D., McKenzie, J. F., & Völk, H. J. 1991, A&A, 245, 79 [NASA ADS] [Google Scholar]
- Choutko, V., & AMS collaboration ICRC 2013 (ID 1262), available at http://www.cbpf.br/icrc2013/proc_icrc2013.html [Google Scholar]
- di Bernardo, G., Evoli, C., Gaggero, D., Grasso, D., & Maccione, L. 2010, Astropart. Phys., 34, 274 [NASA ADS] [CrossRef] [EDP Sciences] [Google Scholar]
- Drury, L. 2011, MNRAS, 415, 1807 [NASA ADS] [CrossRef] [Google Scholar]
- Evoli, C., Gaggero, D., Grasso, D., & Maccione, L. 2008, JCAP, 10, 018 [NASA ADS] [CrossRef] [Google Scholar]
- Gleeson, L. J., & Axford, W. I. 1968, ApJ, 154, 1011 [NASA ADS] [CrossRef] [Google Scholar]
- Haino, S., & AMS collaboration ICRC 2013 (ID 1265), available at http://www.cbpf.br/icrc2013/proc_icrc2013.html [Google Scholar]
- Malkov, M. A., Diamond, P. H., & Sagdeev, R. Z. 2012, Phys. Rev. Lett., 108, 1104 [Google Scholar]
- Miller, J. A., & Roberts, D. A. 1995, ApJ, 452, 912 [NASA ADS] [CrossRef] [Google Scholar]
- Ohira, Y., & Ioka, K. 2011, ApJ, 729, L13 [Google Scholar]
- Potgieter, M. 2013, Braz. J. of Phys., 44, 581 [Google Scholar]
- Ptuskin, V. 2013, ApJ, 763, 47 [Google Scholar]
- Ptuskin, V. S., Völk, H. J., Zirakashvili, V. N., & Breitschwerdt, D. 1997, A&A, 321, 434 [NASA ADS] [Google Scholar]
- Skilling, J. 1975, ApJ, 173, 255 [Google Scholar]
- Stone, E. C., Cummings, A. C., McDonald, F. B., et al. 2013, Science, 341, 150 [NASA ADS] [CrossRef] [PubMed] [Google Scholar]
- Strong, A. W., & Moskalenko, I. V. 1998, ApJ, 509, 212 [NASA ADS] [CrossRef] [Google Scholar]
- Webber, W. R., Kish, J. C., & Schrier, D. A. 1990, Phys. Rev. C, 41, 566 [NASA ADS] [CrossRef] [Google Scholar]
- Webber, W. R., Soutoul, A., Kish, J. C., & Rockstroh, J. M. 2003, ApJS, 144, 153 [NASA ADS] [CrossRef] [Google Scholar]
- Yoon, Y. S., Ahn, H. S., Allison, P. S., et al. 2011, ApJ, 728, 122 [Google Scholar]
All Figures
|
Fig. 1 Spectrum of protons measured by Voyager (blue empty circles), AMS-02 (black filled circles; Aguilar et al. 2015), PAMELA (green empty squares; Adriani 2011) and CREAM (blue filled squares; Yoon et al. 2011), compared with the prediction of our calculations (lines). The solid line is the flux at the Earth after the correction due to solar modulation, while the dashed line is the spectrum in the ISM. |
| In the text | |
|
Fig. 2 Spectrum of He nuclei according to preliminary measurements of AMS-02 (black filled circles), as measured by Voyager (blue empty circles), PAMELA (green empty squares), and CREAM (blue filled squares), compared with the prediction of our calculations (lines). The solid line is the flux at the Earth after the correction due to solar modulation, while the dashed line is the spectrum in the ISM. |
| In the text | |
|
Fig. 3 Spectrum of C nuclei as measured by CREAM (blue squares), PAMELA (green empty squares), and according to preliminary measurements of AMS-02 (black circles), compared with the prediction of our calculations (lines). The solid line is the flux at the Earth after the correction due to solar modulation, while the dashed line is the spectrum in the ISM. |
| In the text | |
|
Fig. 4 B/C ratio as measured by CREAM (blue squares), PAMELA (green empty squares), and according to preliminary measurements of AMS-02 (black circles). The black/bottom solid line is the prediction of our model, while the red/top line has been obtained by adding a source grammage of 0.15 g cm-2, close to that given by Eq. (10). |
| In the text | |
Current usage metrics show cumulative count of Article Views (full-text article views including HTML views, PDF and ePub downloads, according to the available data) and Abstracts Views on Vision4Press platform.
Data correspond to usage on the plateform after 2015. The current usage metrics is available 48-96 hours after online publication and is updated daily on week days.
Initial download of the metrics may take a while.