Fig. 3
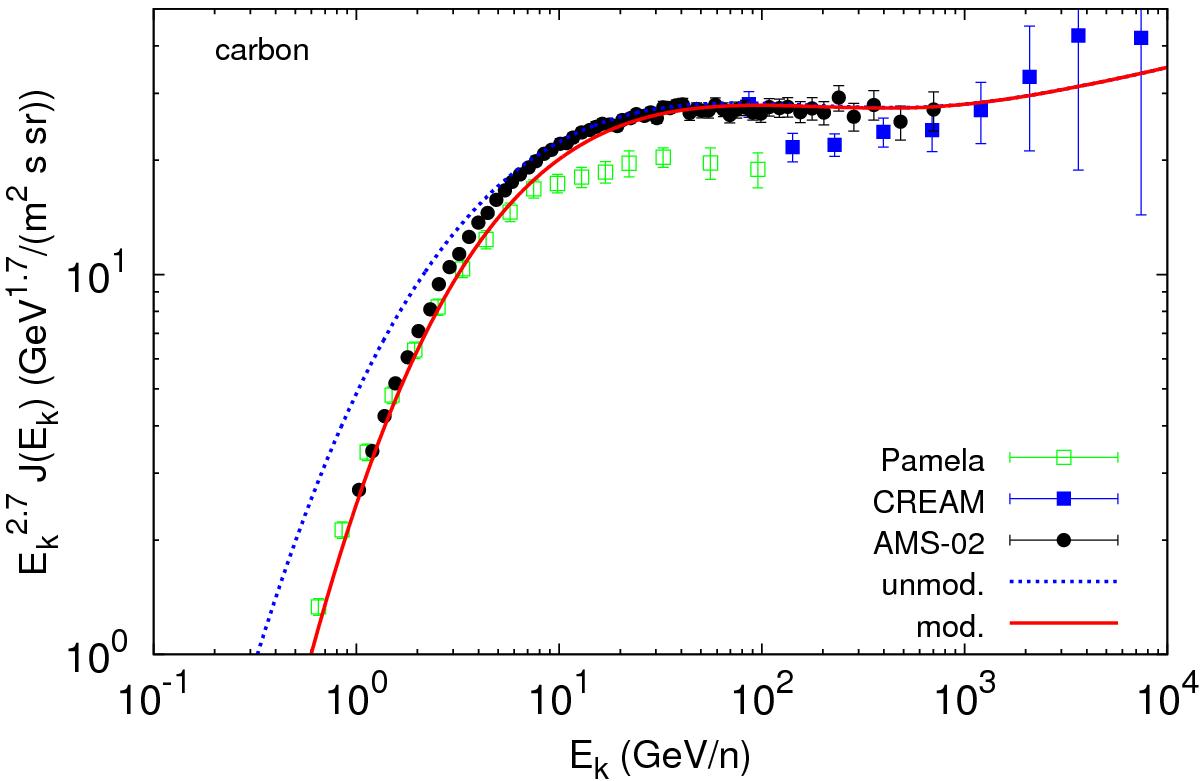
Spectrum of C nuclei as measured by CREAM (blue squares), PAMELA (green empty squares), and according to preliminary measurements of AMS-02 (black circles), compared with the prediction of our calculations (lines). The solid line is the flux at the Earth after the correction due to solar modulation, while the dashed line is the spectrum in the ISM.
Current usage metrics show cumulative count of Article Views (full-text article views including HTML views, PDF and ePub downloads, according to the available data) and Abstracts Views on Vision4Press platform.
Data correspond to usage on the plateform after 2015. The current usage metrics is available 48-96 hours after online publication and is updated daily on week days.
Initial download of the metrics may take a while.