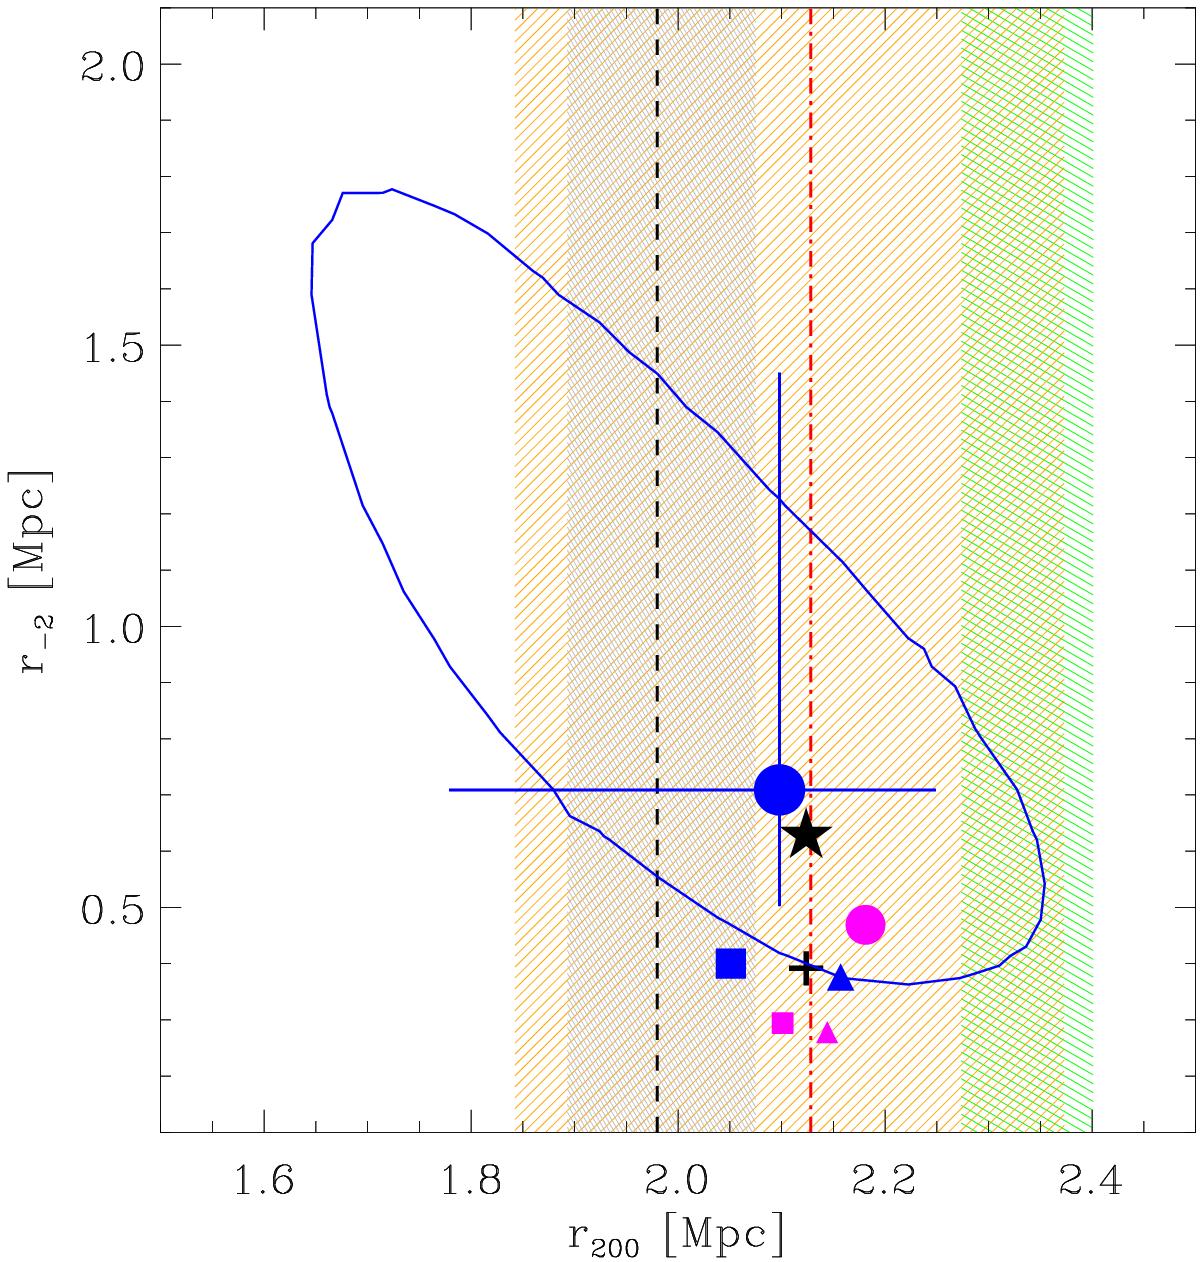
Fig. 9

Results of the dynamical analysis in the r-2 vs. r200 plane. The squares, dots, and triangles indicate the best-fit values obtained by MAMPOSSt for the Her, NFW, and Bur mass models. Magenta and blue symbols are for the C and T β(r) models, respectively. The symbol size is proportional to the MAMPOSSt likelihood. The ellipse indicates the 1σ uncertainty on the best-fit MAMPOSSt results, after marginalization over the velocity anisotropy parameter. The error bars are obtained upon marginalization of each parameter over the other two. The cross indicates the mean of the values obtained with the different models considered for the MAMPOSSt analysis. The vertical black dashed line indicates the value of r200 obtained from the cluster velocity dispersion using the scaling relation of Munari et al. (2013). The shaded grey region indicates the uncertainties in this value. The vertical red dash-dotted line indicates the value of r200 obtained with the Caustic technique of Diaferio & Geller (1997). The shaded orange region indicates the uncertainties in this value. The shaded green region indicates the range of r200 as obtained from the range of X-ray temperatures found in the literature (see text), using the scaling relation of Vikhlinin et al. (2009). The star symbol represents the theoretical expectation from De Boni et al. (2013), obtained adopting the average value of r200.
Current usage metrics show cumulative count of Article Views (full-text article views including HTML views, PDF and ePub downloads, according to the available data) and Abstracts Views on Vision4Press platform.
Data correspond to usage on the plateform after 2015. The current usage metrics is available 48-96 hours after online publication and is updated daily on week days.
Initial download of the metrics may take a while.


