Fig. 3
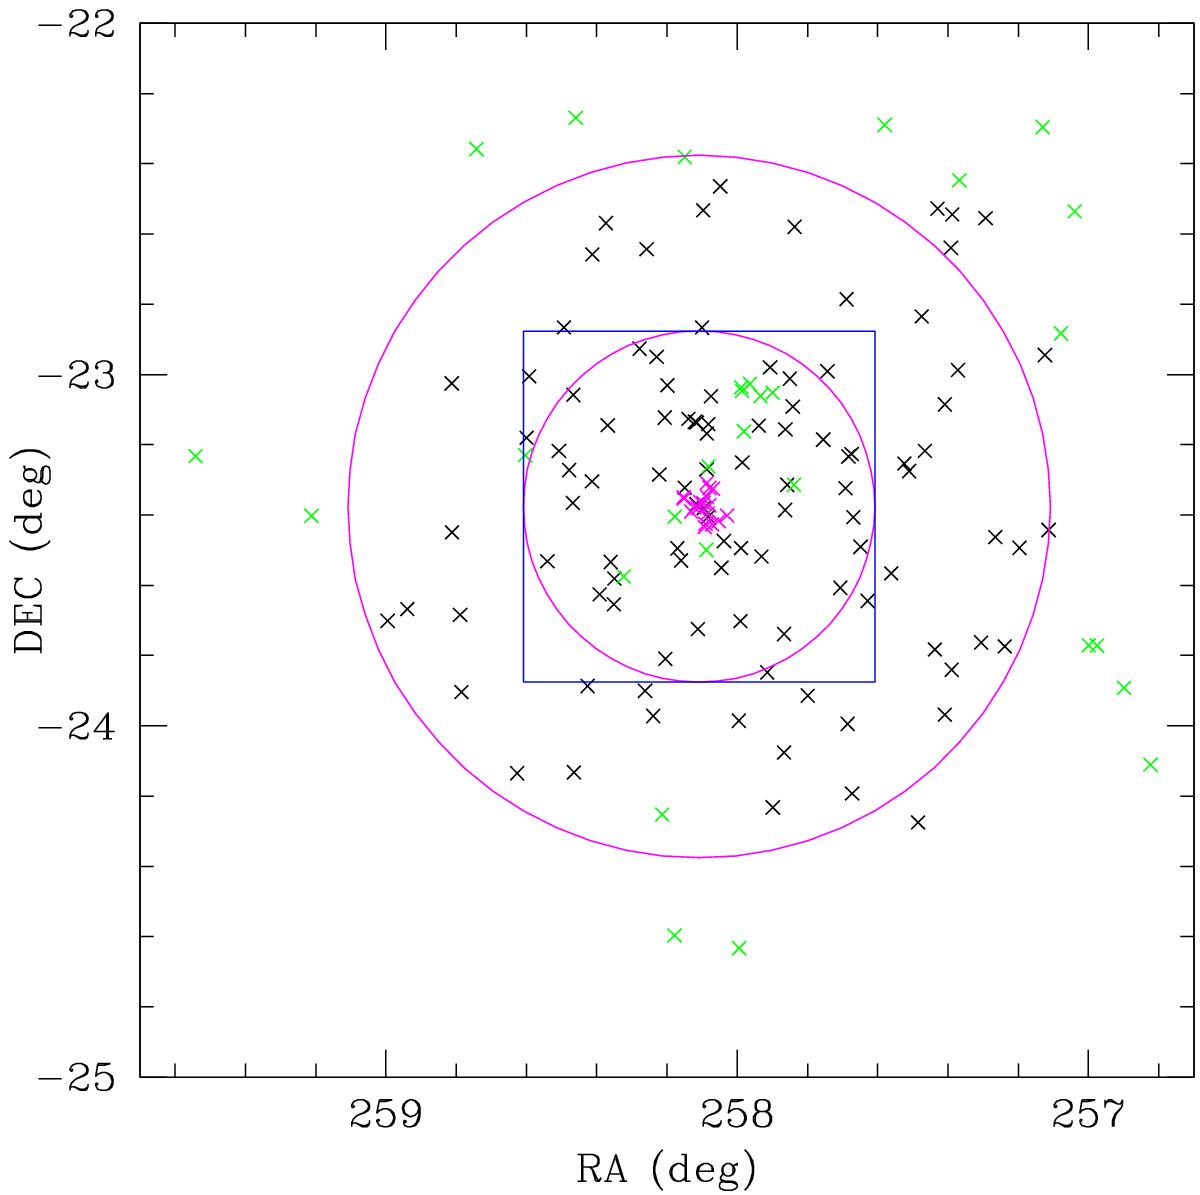
Spatial distribution of the galaxies with spectroscopic redshifts, colour-coded as follows: magenta crosses: our FORS2 measurements; green crosses: Hasegawa measurements; and black crosses: values found in NED. The two magenta circles have radii of 0.5 deg (1 Mpc) and 1 deg (2 Mpc) and the blue square shows the size of the Megacam g′ and r′ band images.
Current usage metrics show cumulative count of Article Views (full-text article views including HTML views, PDF and ePub downloads, according to the available data) and Abstracts Views on Vision4Press platform.
Data correspond to usage on the plateform after 2015. The current usage metrics is available 48-96 hours after online publication and is updated daily on week days.
Initial download of the metrics may take a while.