Fig. 2
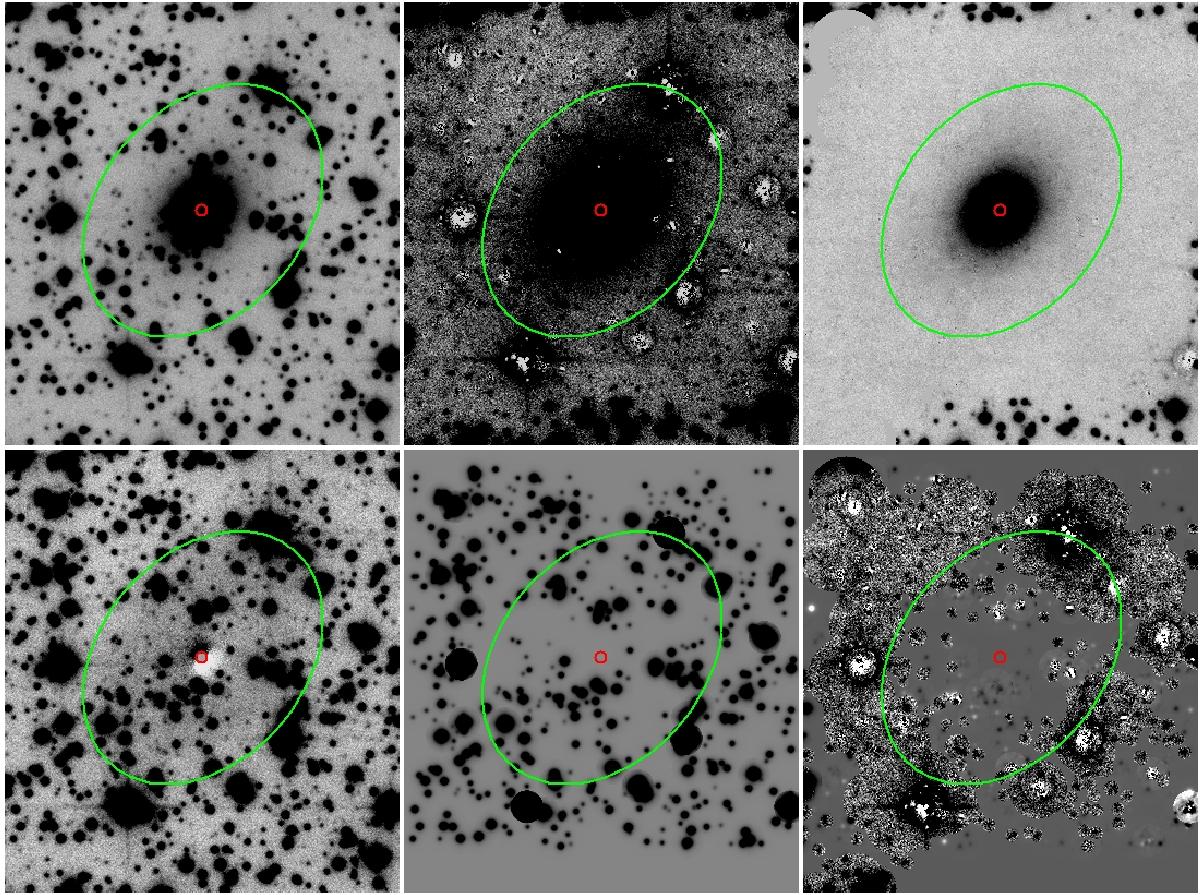
Images illustrating our method for star subtraction. The field of view of each image is about 1.1 × 1.3 arcmin2 in the east-west and north-south directions, respectively. The small red circles indicate the position of the nucleus and the green ellipses represent the outer boundary of the galaxy. Top left a): original r′ band image of 2MASX J17121895-2322192 = OPH 171218.98-232219.1, one of the brightest galaxies. Bottom left b): stellar component after subtracting the galaxy model from image a). This image is almost free of galaxy light, and so it is appropriate for the evaluation of stellar parameters and measuring the PSFs. Top middlec): extracted galaxy image after automated star subtraction with PSFs. Since irregular residuals of saturated stars are not well removed, they disturb the galaxy profile and its surrounding sky area. Bottom middle d): image showing the automatically subtracted stars. This is the difference between images a) and c) and shows that more than 100 stars superposed on the galaxy are removed. Top righte): final image of the galaxy after manual cleaning of residuals around saturated stars in image c). Bottom rightf): residuals left after manual cleaning. This is the difference between images c) and e).
Current usage metrics show cumulative count of Article Views (full-text article views including HTML views, PDF and ePub downloads, according to the available data) and Abstracts Views on Vision4Press platform.
Data correspond to usage on the plateform after 2015. The current usage metrics is available 48-96 hours after online publication and is updated daily on week days.
Initial download of the metrics may take a while.