Free Access
Fig. 11
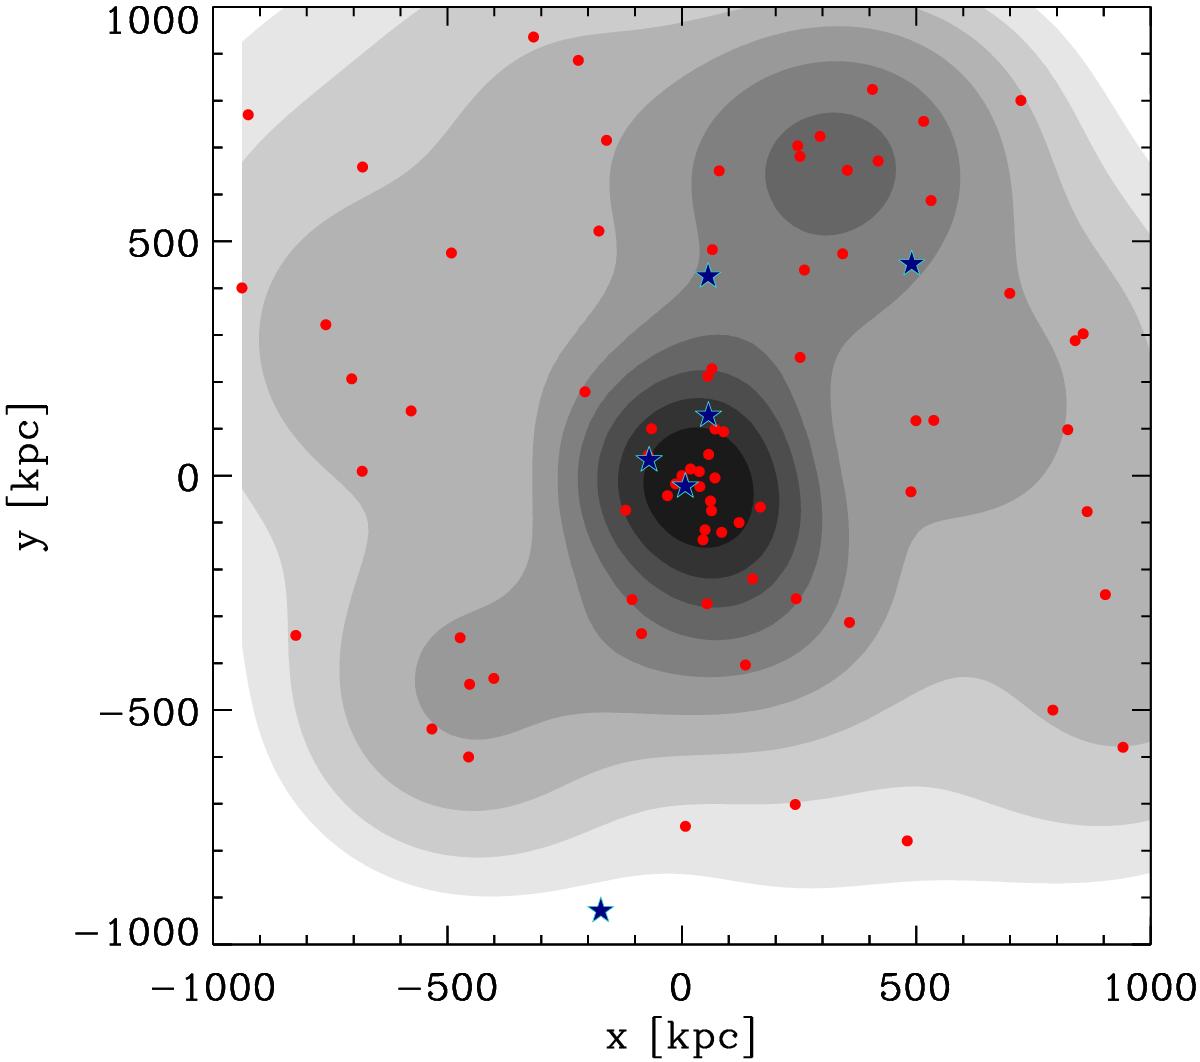
Adaptive-kernel number density map of the galaxies in structure 1 of the SG substructure analysis. The contours are logarithmically spaced. Red dots indicate the positions of the galaxies belonging to this group. Blue stars indicate the positions of the galaxies belonging to group 2 in the SG substructure analysis.
Current usage metrics show cumulative count of Article Views (full-text article views including HTML views, PDF and ePub downloads, according to the available data) and Abstracts Views on Vision4Press platform.
Data correspond to usage on the plateform after 2015. The current usage metrics is available 48-96 hours after online publication and is updated daily on week days.
Initial download of the metrics may take a while.