Fig. 10
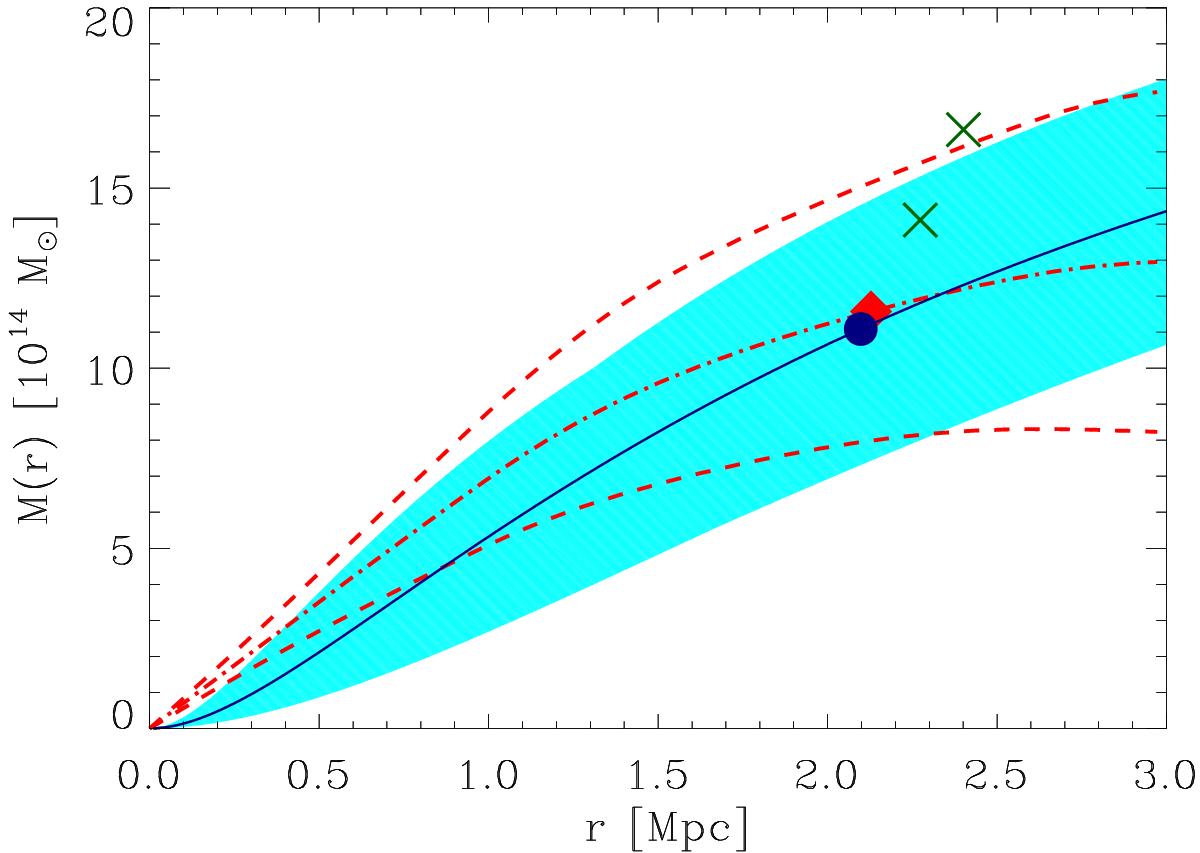
Cluster mass profile as obtained from MAMPOSSt (solid blue line) within its 1σ confidence interval (dashed cyan region). The blue dot is the location of [r200,M200]. The dash-dotted and dashed red lines indicate the cluster mass profile obtained from the Caustic technique and, its 1σ upper and lower limits respectively. The red diamond is the location of [r200,M200]. The green X symbols indicate the locations of [r200,M200] obtained using the observed range of cluster TX and the scaling relation of Vikhlinin et al. (2009).
Current usage metrics show cumulative count of Article Views (full-text article views including HTML views, PDF and ePub downloads, according to the available data) and Abstracts Views on Vision4Press platform.
Data correspond to usage on the plateform after 2015. The current usage metrics is available 48-96 hours after online publication and is updated daily on week days.
Initial download of the metrics may take a while.