Fig. 8
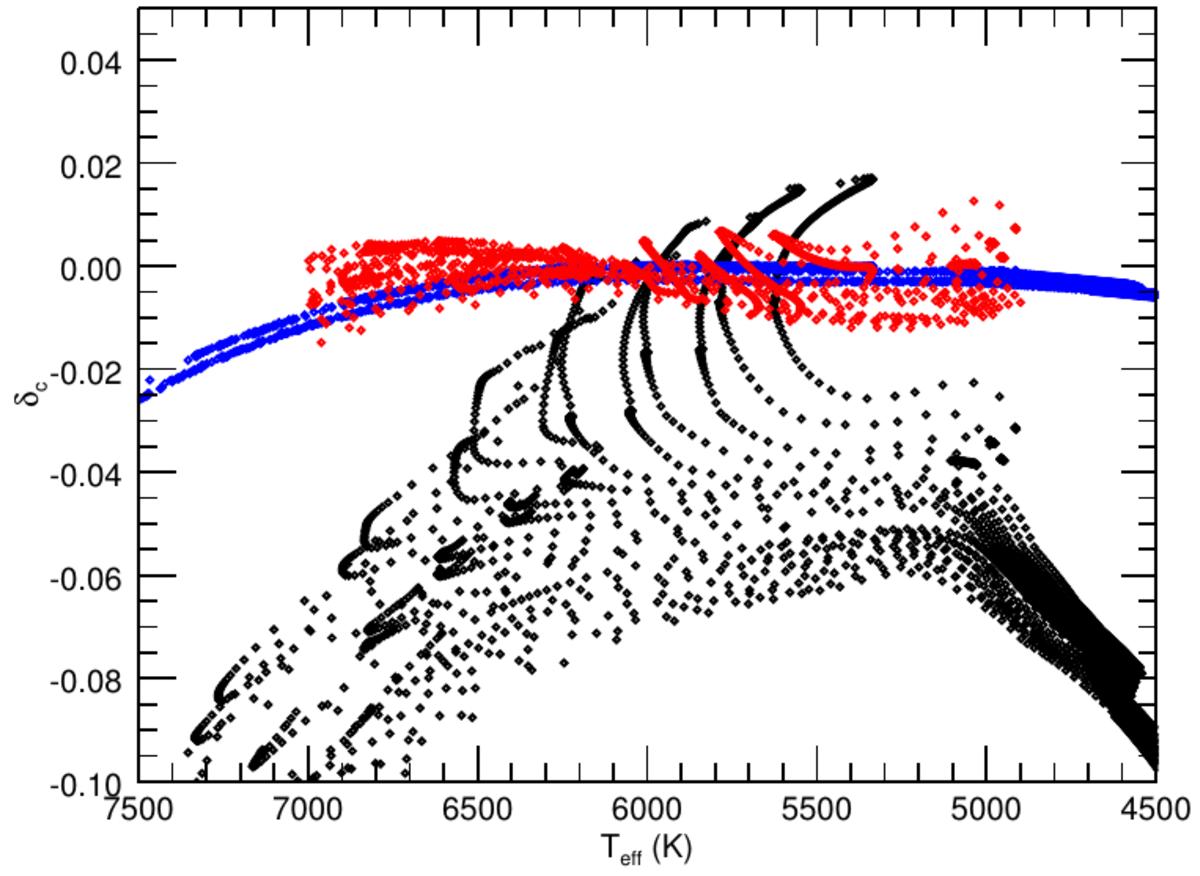
Relative differences δc as a function of Teff (black dots). Blue points are the same relative differences but considering the isothermal cut-off frequency ωa instead of ωc. Red points are the residuals after correcting with the polynomial fit indicated in the text. The fit is limited to models with Teff< 7000 K and νcut> 500μHz.
Current usage metrics show cumulative count of Article Views (full-text article views including HTML views, PDF and ePub downloads, according to the available data) and Abstracts Views on Vision4Press platform.
Data correspond to usage on the plateform after 2015. The current usage metrics is available 48-96 hours after online publication and is updated daily on week days.
Initial download of the metrics may take a while.