Fig. 14
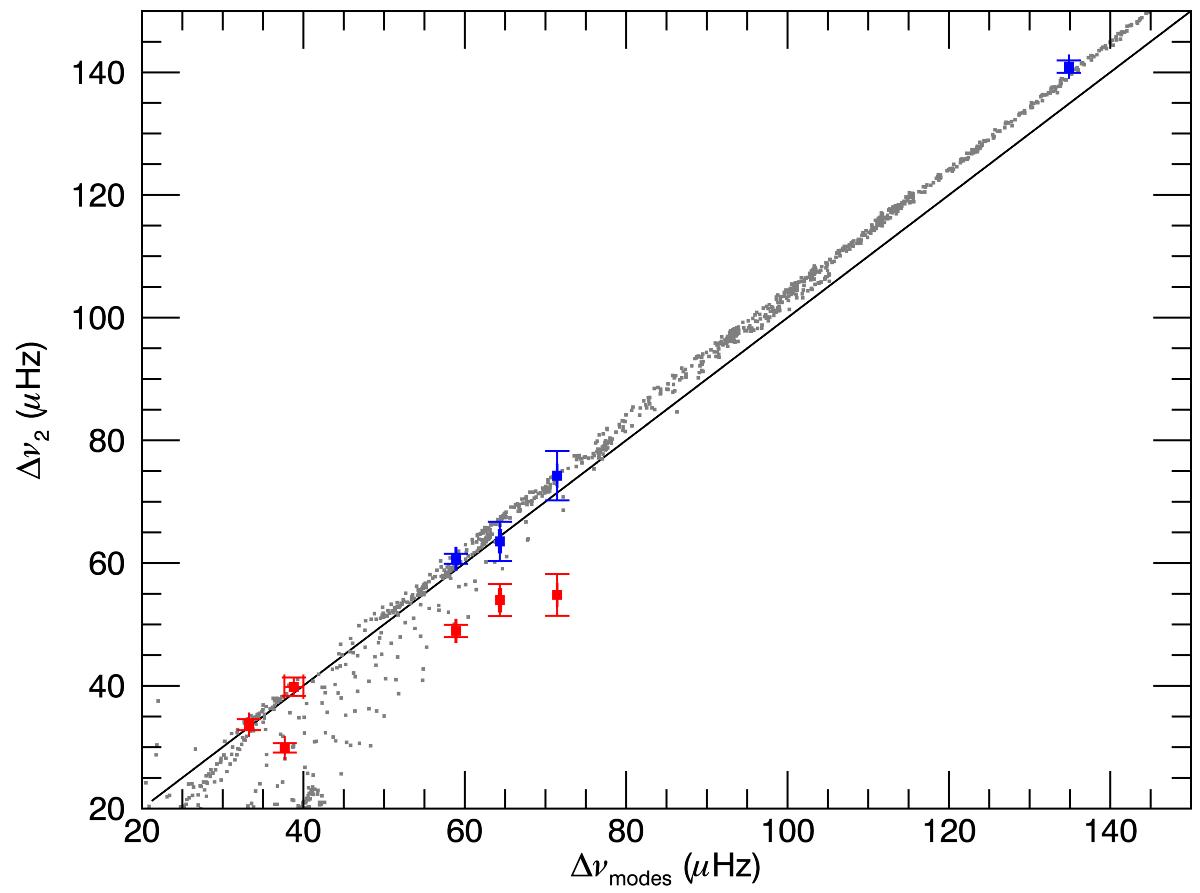
Grey points are periods of the pseudo-mode interference pattern for evolution sequences with masses between 0.9 M⊙ and 2 M⊙. For the sake of clarity, only waves with no surface reflections are shown. Red points correspond to the observed Δν2 values and blue points correspond to 2Δν1 when observed. The black line corresponds to Δνmodes = Δν2.
Current usage metrics show cumulative count of Article Views (full-text article views including HTML views, PDF and ePub downloads, according to the available data) and Abstracts Views on Vision4Press platform.
Data correspond to usage on the plateform after 2015. The current usage metrics is available 48-96 hours after online publication and is updated daily on week days.
Initial download of the metrics may take a while.