Fig. 12
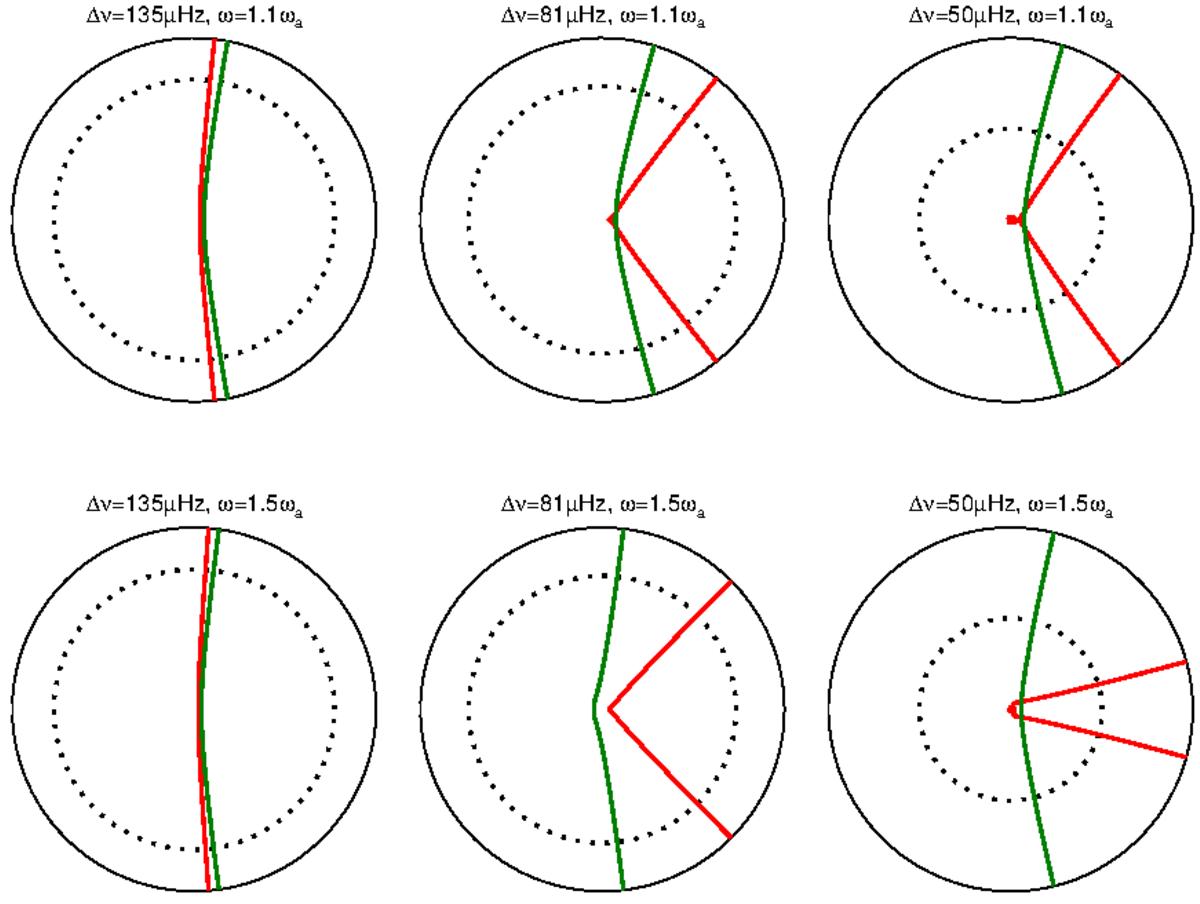
Ray path for waves with angular degrees ℓ = 1 (red) and ℓ = 2 (green) for a 1.1 M⊙ model evolution sequence. For clarity, surface reflections have been omitted. The upper part shows rays with a frequency a 10% greater than the acoustic cut-off frequency ωa, while the bottom panels corresponds to rays with a frequency 50% greater than ωa. The large separation indicated is the integral ![]() and can be used to identified the models in Fig. 13. The leftmost panels correspond to a model near the ZAMS, the middle panels indicate a model near the TAMS, and the rightmost panels indicate a model in the RGB. The dotted circles indicate the base of the convection zone.
and can be used to identified the models in Fig. 13. The leftmost panels correspond to a model near the ZAMS, the middle panels indicate a model near the TAMS, and the rightmost panels indicate a model in the RGB. The dotted circles indicate the base of the convection zone.
Current usage metrics show cumulative count of Article Views (full-text article views including HTML views, PDF and ePub downloads, according to the available data) and Abstracts Views on Vision4Press platform.
Data correspond to usage on the plateform after 2015. The current usage metrics is available 48-96 hours after online publication and is updated daily on week days.
Initial download of the metrics may take a while.