Fig. 11
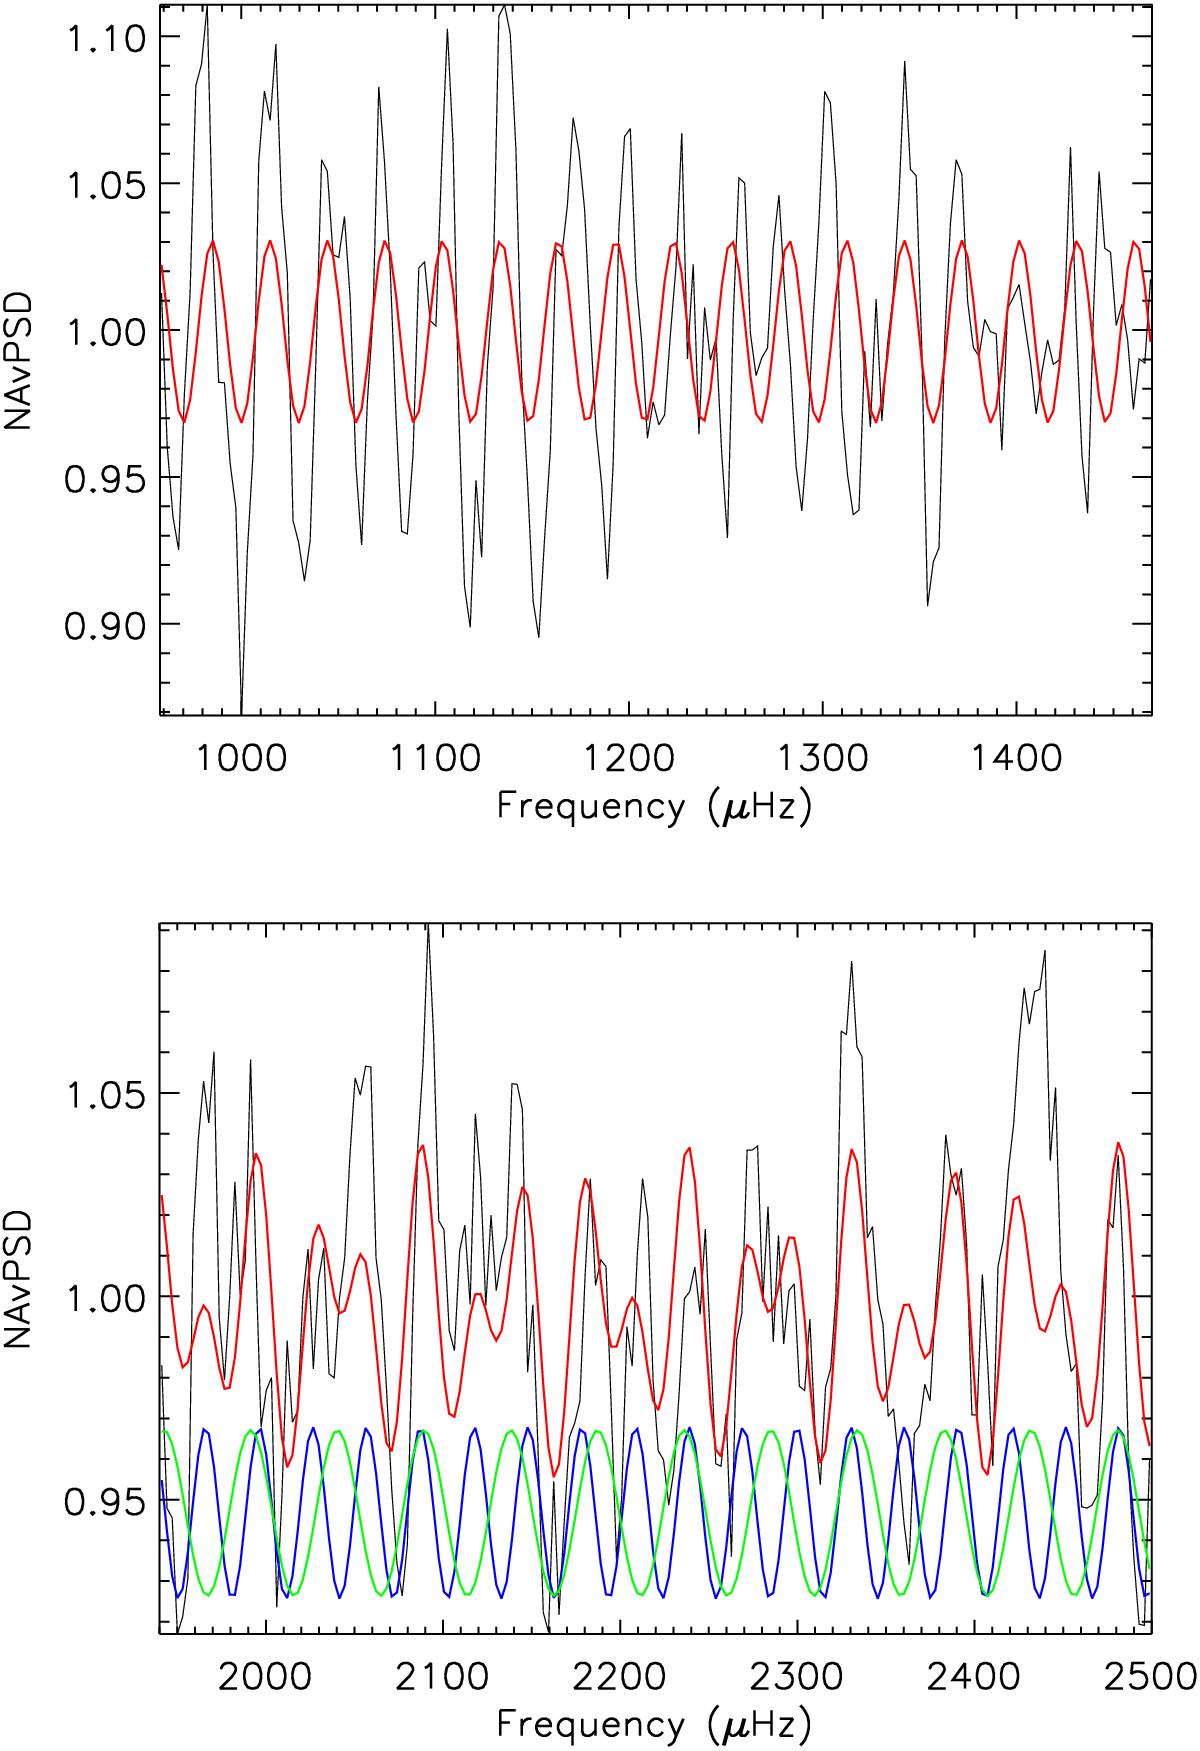
HIPs region of KIC 11717120 (top), where the HIP pattern is dominated by the sine wave (red line), owing to the interference between direct and refracted waves; and the region of KIC 7940546 (bottom), where the two HIP patterns can be determined. The blue and green lines in the bottom panel correspond to the two fitted sine waves with frequencies Δν1 and Δν2, respectively. We shifted the green and blue lines by 0.05 for clarity. The red line is the actual fit.
Current usage metrics show cumulative count of Article Views (full-text article views including HTML views, PDF and ePub downloads, according to the available data) and Abstracts Views on Vision4Press platform.
Data correspond to usage on the plateform after 2015. The current usage metrics is available 48-96 hours after online publication and is updated daily on week days.
Initial download of the metrics may take a while.