Free Access
Fig. 10
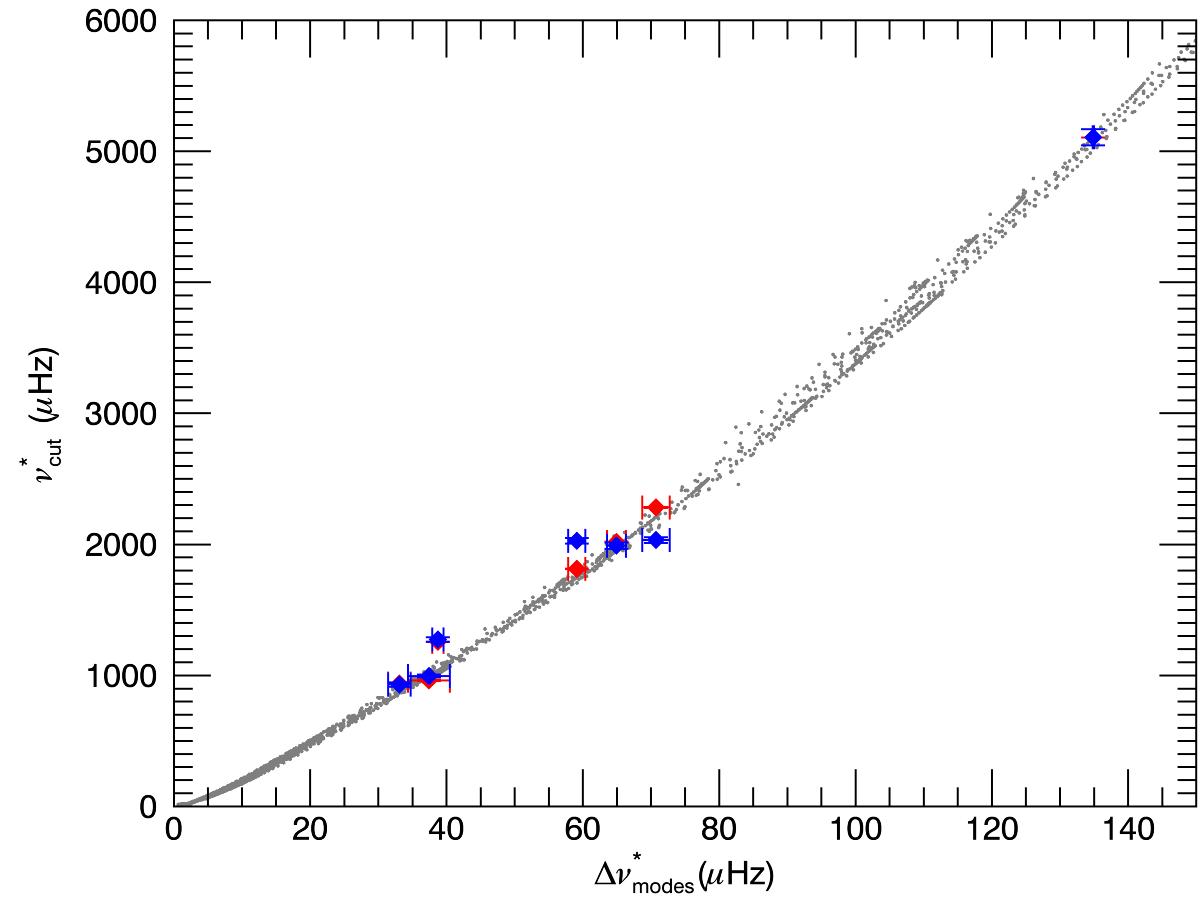
Effective ![]() versus the effective
versus the effective ![]() for our set of models (grey dots) and for the observed stars (blue dots). Red points are observed values of the frequencies of maximum amplitude properly scaled, (νcut/νmax)⊙νmax.
for our set of models (grey dots) and for the observed stars (blue dots). Red points are observed values of the frequencies of maximum amplitude properly scaled, (νcut/νmax)⊙νmax.
Current usage metrics show cumulative count of Article Views (full-text article views including HTML views, PDF and ePub downloads, according to the available data) and Abstracts Views on Vision4Press platform.
Data correspond to usage on the plateform after 2015. The current usage metrics is available 48-96 hours after online publication and is updated daily on week days.
Initial download of the metrics may take a while.