Fig. 9
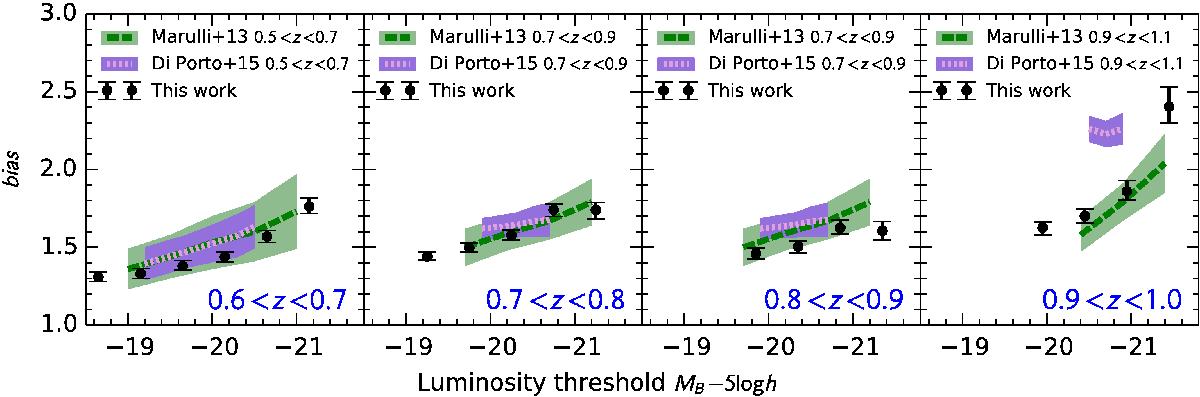
Galaxy bias measured from the full (red and blue combined) VIPERS galaxy sample in luminosity threshold bins. Reference data are taken from the VIPERS projected correlation function analysis (Marulli et al. 2013) and counts-in-cells probability distribution function analysis (Di Porto et al. 2014). We note that the redshift ranges differ.
Current usage metrics show cumulative count of Article Views (full-text article views including HTML views, PDF and ePub downloads, according to the available data) and Abstracts Views on Vision4Press platform.
Data correspond to usage on the plateform after 2015. The current usage metrics is available 48-96 hours after online publication and is updated daily on week days.
Initial download of the metrics may take a while.