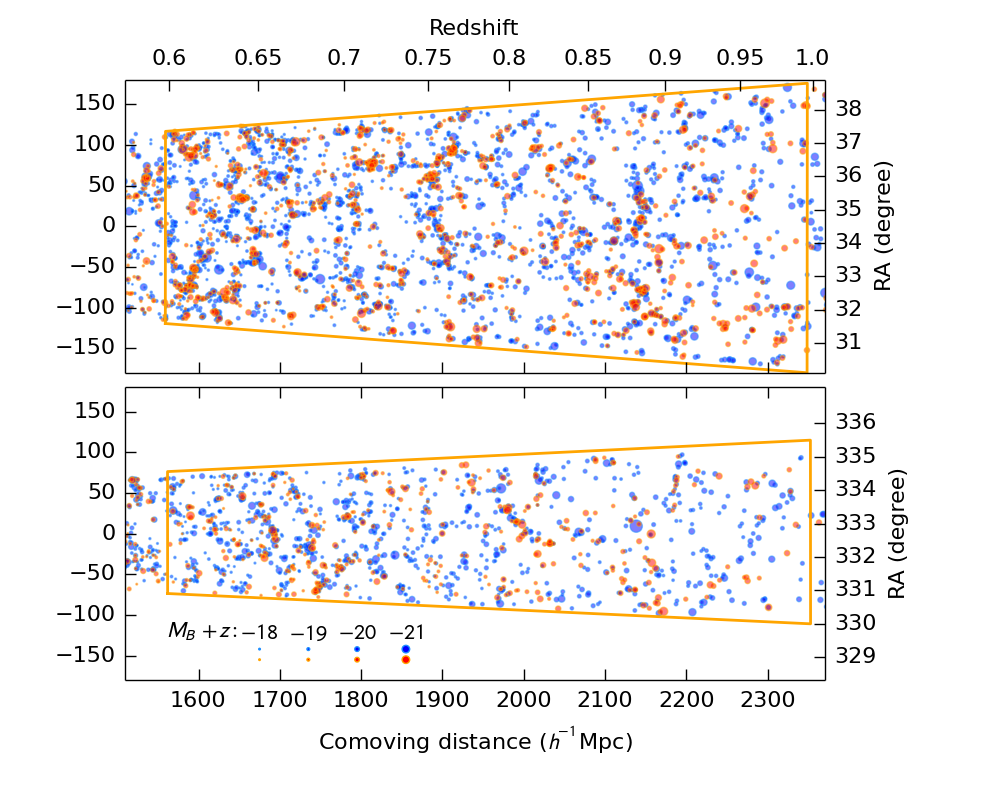
Fig. 5
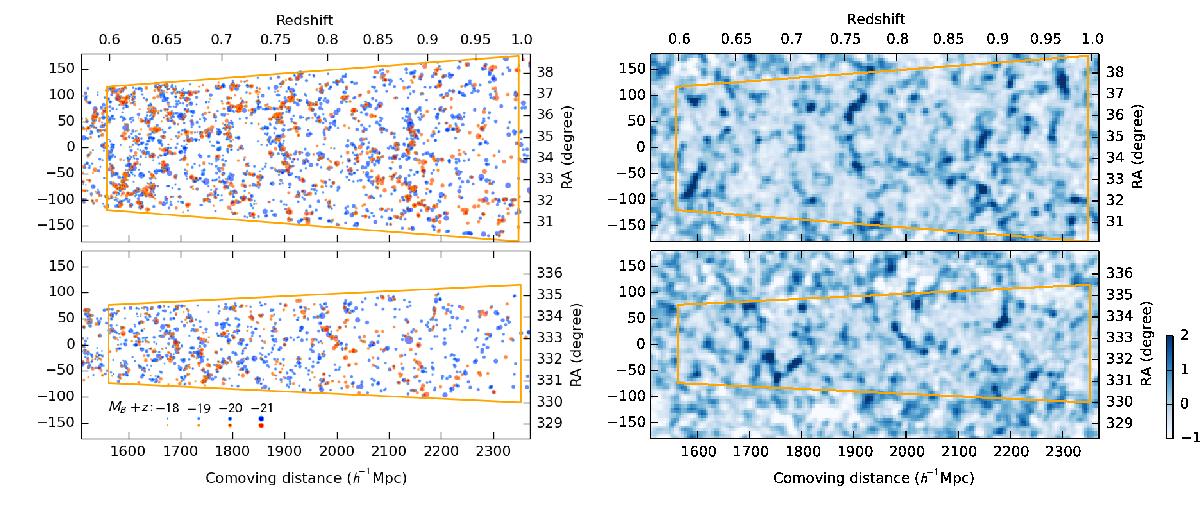
VIPERS cone diagrams for the fields W1 (top) and W4 (bottom). The left panels show the redshift-space positions of observed galaxies. The marker colour indicates the blue or red colour class and the marker size scales with B-band luminosity. The depth of the slice is 10 h-1 Mpc. The orange line traces the field boundaries cut in the redshift direction at 0.6 <z< 1.0. At right we show a slice of the density field taken from one step in the Markov chain. It represents the anisotropic Wiener reconstruction from the weighted combination of galaxy tracers. The field is filled with a constrained Gaussian realisation. The field has been smoothed with a Gaussian kernel with a full width half maximum of 10 h-1 Mpc. The colour scale gives the over-density value.
Current usage metrics show cumulative count of Article Views (full-text article views including HTML views, PDF and ePub downloads, according to the available data) and Abstracts Views on Vision4Press platform.
Data correspond to usage on the plateform after 2015. The current usage metrics is available 48-96 hours after online publication and is updated daily on week days.
Initial download of the metrics may take a while.