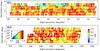
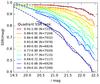
Fig. 4

The spectroscopic success rate (SSR) quantifies the fraction of targets for which the redshift could be measured with >95% confidence. On the left we show the mean SSR of each pointing divided by quadrant (7 × 8 arcmin). The inset histogram gives the cumulative number of quadrants with SSR below the given value. On the right, we show the SSR as a function of iAB magnitude (solid curves) with an analytic fit (dashed curves). The sample is divided based on the overall quality of the quadrants quantified by SSR. The quadrants are ranked by mean SSR and the curves are computed for each decile. The range of SSR and the number of sources in the bin are given in the figure legend.
Current usage metrics show cumulative count of Article Views (full-text article views including HTML views, PDF and ePub downloads, according to the available data) and Abstracts Views on Vision4Press platform.
Data correspond to usage on the plateform after 2015. The current usage metrics is available 48-96 hours after online publication and is updated daily on week days.
Initial download of the metrics may take a while.