Fig. 2
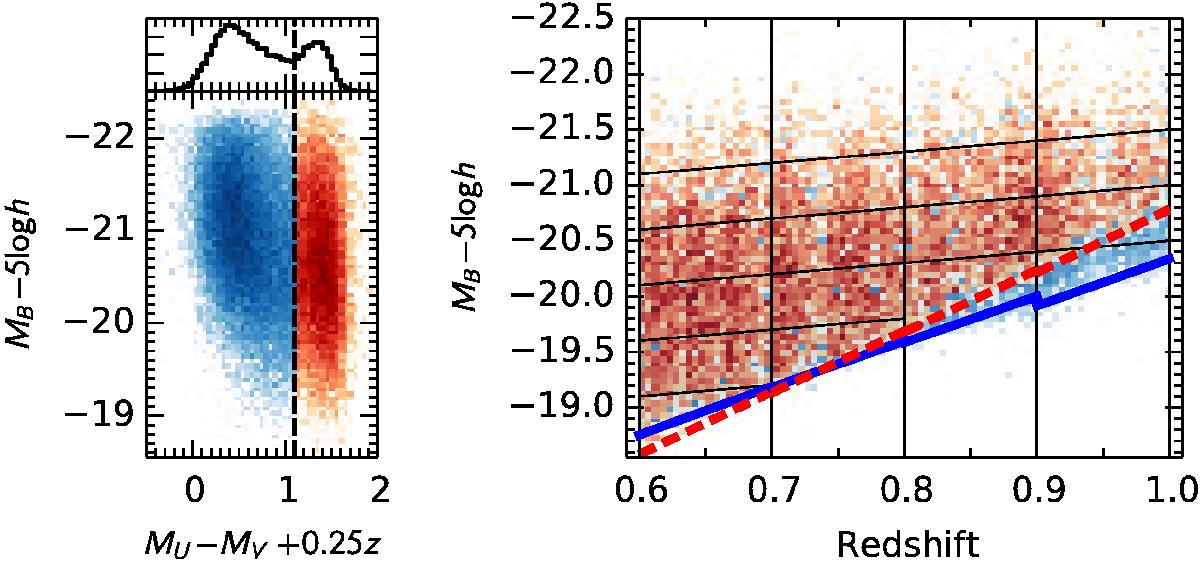
Subsamples of galaxies in colour, absolute magnitude and redshift bins. Left: the absolute magnitude-colour plane. The histogram at top shows the distribution of colour. The sample is divided into blue and red classes following Fritz et al. (2014) at MU−MV + 0.25z = 1.1. Right: the sample is further binned by redshift and absolute magnitude. The luminosity bins account for the mean evolutionary trend. The faintest luminosity bins are not volume limited and the thick blue and dashed red curves show the limiting magnitudes for blue and red galaxy classes.
Current usage metrics show cumulative count of Article Views (full-text article views including HTML views, PDF and ePub downloads, according to the available data) and Abstracts Views on Vision4Press platform.
Data correspond to usage on the plateform after 2015. The current usage metrics is available 48-96 hours after online publication and is updated daily on week days.
Initial download of the metrics may take a while.