| Issue |
A&A
Volume 583, November 2015
Rosetta mission results pre-perihelion
|
|
|---|---|---|
| Article Number | A23 | |
| Number of page(s) | 5 | |
| Section | Planets and planetary systems | |
| DOI | https://doi.org/10.1051/0004-6361/201526316 | |
| Published online | 30 October 2015 | |
Negatively charged nano-grains at 67P/Churyumov-Gerasimenko
1 Department of Atmospheric, Oceanic and Space Sciences, The University of Michigan, Ann Arbor, MI 48109, USA
e-mail: This email address is being protected from spambots. You need JavaScript enabled to view it.
2 Space Science and Engineering Division, Southwest Research Institute, San Antonio, TX 78228, USA
e-mail: This email address is being protected from spambots. You need JavaScript enabled to view it.
3 Department of Physics, University of Colorado, Boulder, CO 80303, USA
e-mail: This email address is being protected from spambots. You need JavaScript enabled to view it.
Received: 15 April 2015
Accepted: 8 July 2015
Abstract
Shortly after the Rosetta mission’s rendezvous with 67P/Churyumov-Gerasimenko the RPC/IES instrument intermittently detected negative particles that were identified as singly charged nano-dust grains. These grains were recorded as a nearly mono-energetic beam of particles in the 200−500 eV range arriving from the direction of the comet. Occasionally, another population of particles in the energy range of 1−20 keV were also noticed arriving from the approximate direction of the Sun. In this paper we review the processes that can explain the energization and the directionality of the observed nano-dust populations. We show that the observations are consistent with gas-drag acceleration of the outflowing particles with radii of 3−4 nm, and with the returning fragments of bigger particles accelerated by radiation pressure with approximate radii of 30−80 nm. In addition to gas drag and radiation pressure, we also examine the role of the solar wind induced motional electric field, and its possible role in explaining the intermittency of the detection of a nano-grain population arriving from the solar direction.
Key words: comets: general / comets: individual: 67P/Churyumov- Gerasimenko
© ESO, 2015
1. Introduction
In early August 2014, after a decade-long journey, the Rosetta mission (Glassmeier et al. 2007) started to make in situ and remote sensing observations of comet 67P/Churyumov-Gerasimenko (67P) at a heliocentric distance of d ≃ 3.5 AU. The Rosetta Plasma Consortium (RPC) instrument package (Carr et al. 2007) started to map the fluxes and energy distributions of electrons and ions in the vicinity of the comet (Broiles et al. 2015; Burch et al. 2015; Clark et al. 2015; Fuselier et al. 2015; Nilsson et al. 2015). In August 2014, Rosetta was about 100 km away from the comet, following a path in between the Sun and the nucleus. In addition to the expected solar wind plasma particles, and photoelectrons from the nucleus and the spacecraft itself, the Ion and Electron Sensor (IES) also observed two distinct intermittent populations of negatively charged particles: a) a nearly mono-energetic beam of particles in the 200−500 eV range arriving from the direction of the comet; and b) a population of 1 to 20 keV particles arriving from the approximate direction of the Sun (Burch et al. 2015). These particles were identified as singly-charged nano-dust particles, similar to the recently identified population of nano-grains in the plumes of Enceladus at Saturn (Jones et al. 2009; Hill et al. 2012). Figure 1 shows an example of the observations. In this paper we identify the possible processes that could explain the energy distribution, intermittency, and the directionality of the observed nano-dust particles.
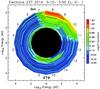 |
Fig. 1 Contour plot of log(counts) on a polar log(Energy)−log(Energy) diagram for the time period 0500−0600 UT on August 25, 2014. The top (Sun) segments 7−11 indicate the 1−20 keV nano-dust population arriving from the approximate direction of the Sun canted away in the direction of the orbital motion of comet 67P. At the bottom (67P) segments 0−14 are the ~200−500 eV negative particles. The polar plot indicates the arrival angles of the particles in the instrument frame of reference (Burch et al. 2015). |
It should be noted that the calculations presented in this paper are relevant for the mission phase when 67P was still relatively far from the Sun and its Keplerian motion still relatively slow. Closer to perihelion, this scenario is less realistic: the comet is moving more rapidly along its orbit, the angle between the sunward direction from the comet and the orbital velocity vector will become larger, reaching 90 degrees at perihelion itself.
In Sect. 1 we briefly review the expected properties of cometary dust particles. In Sect. 2 we estimate the energy of the small dust particles that are accelerated by gas drag away from the nucleus. In Sect. 3 we describe the effects of radiation pressure. Section 4 is dedicated to exploring the effects of the motional electric field of the solar wind on the trajectories of nano-particles, and its possible role in shaping the sporadic nature of the observations of the population of particles arriving from the solar direction. In Sect. 5 we discuss the timescales for electrostatic charging of the nano-dust particles, and its expected effects on the fragmentation of larger, micron-sized particles, the suggested parent bodies of the returning nano-grains. In Sect. 6 we summarize the results and our expectations for future nano-dust measurements as 67P approaches the Sun.
2. Grain aggregates
The Rosetta dust instruments have observed very fluffy small grains (see Schulz et al. 2015; Rotundi et al. 2015). It was also noted that >50 μm grains are mainly composed of refractory material (Schulz et al. 2015). On the other hand it has also been established that nano-grains (those with characteristic size ≲1 μm) are mainly composed of water molecules (Protopapa et al. 2014).
Here we assume that these nano-grains are fluffy aggregates of individual water clusters with radii of <10 nm. The individual water clusters are assumed to be densely packed spheres filled with water molecules. The size of an individual water molecule is aw ≈ 0.15 nm and these densely packed clusters have a bulk density of ρw = 2130 kg/m3. Larger nano-grains are composed of a loose conglomerate of “cluster balls”. This assumption means that the dust grain bulk density decreases with increasing grain size. Here we adopt a model for grain bulk density![Mathematical equation: \begin{equation} \rho_a = \frac{1}{3}\rho_{\rm w}\left[1+2\exp\left({-\frac{a}{10 a_{\rm w}}}\right)\right]\cdot \label{eq:bulk} \end{equation}](/articles/aa/full_html/2015/11/aa26316-15/aa26316-15-eq12.png) (1)Hence, the number of water molecules in a nano-grain can be expressed by
(1)Hence, the number of water molecules in a nano-grain can be expressed by ![Mathematical equation: \begin{equation} N_{\rm w} = \frac{4\pi}{9} \frac{\rho_{\rm w} a^3}{m_{\rm w}}\left[1+2\exp\left({-\frac{a}{10 a_{\rm w}}}\right)\right], \label{eq:water} \end{equation}](/articles/aa/full_html/2015/11/aa26316-15/aa26316-15-eq13.png) (2)where mw is the mass of a water molecule. In this model a 1nm cluster has about 200 water molecules and a 10 nm cluster is composed of ≈105 molecules. Particles with radii a> 10 nm have a characteristic bulk density ρa = 700 kg/m3.
(2)where mw is the mass of a water molecule. In this model a 1nm cluster has about 200 water molecules and a 10 nm cluster is composed of ≈105 molecules. Particles with radii a> 10 nm have a characteristic bulk density ρa = 700 kg/m3.
A natural consequence of this model is that the larger nano-grains are fragile and can easily break into smaller fragments. This property plays an important role in explaining the observed directional distribution of cometary nano-grains.
3. Gas drag acceleration
The dust terminal velocity (due to gas drag), Va, is given by Eqs. (84) through (86) in Gombosi et al. (1986), ![Mathematical equation: \begin{equation} V_{a} = u_{\rm gas}\left[1 - \exp\left(-\frac{\psi_a}{\kappa_a} - \frac{V_{a}}{u_{\rm gas}}\right)\right] \label{eq:dust0a} , \end{equation}](/articles/aa/full_html/2015/11/aa26316-15/aa26316-15-eq20.png) (3)where ugas = 700 m/s is the gas terminal velocity, while the dimensionless quantities ψa and κa are given by
(3)where ugas = 700 m/s is the gas terminal velocity, while the dimensionless quantities ψa and κa are given by ![Mathematical equation: \begin{eqnarray} \psi_a &=& \frac{\sqrt{5\pi}}{12\sqrt{6}} \, \frac{k T_{\rm gas}}{m_{\rm u} u_{\rm gas}^2} \left[\sqrt{\frac{T_a}{T_{\rm gas}}} + \frac{8}{\pi}\sqrt{\frac{T_{\rm min}+T_{\rm c} \kappa_a} {T_{\rm gas} + T_{\rm gas}\kappa_a}}\right] \label{eq:dust1a} \\ \kappa_a &=& \frac{2}{3} \sqrt{\frac{5 kT_\snull}{2 m_{\rm u}}}\frac{a \rho_a}{\dot{z} R_n}\cdot \label{eq:dust2a} \end{eqnarray}](/articles/aa/full_html/2015/11/aa26316-15/aa26316-15-eq24.png) Here ż is the gas mass production rate per unit surface area (determined such that the total gas production rate is Q = 8 × 1025 water molecules per second where 5% of the surface area is active); mu is the atomic mass unit (mu = 1.66 × 10⁻²⁷ kg); Rn = 1.8 km is the effective radius of the nucleus; T0, Tgas, Tc, and Tmin are the surface temperature, the gas temperature at the distance where the grain terminal velocity is reached, the temperature at the sonic point, and the minimum gas temperature in the coma, respectively. In the present paper we use the values T0 = 200 K, Tgas = 100 K, Tc = 150 K, and Tmin = 50 K.
Here ż is the gas mass production rate per unit surface area (determined such that the total gas production rate is Q = 8 × 1025 water molecules per second where 5% of the surface area is active); mu is the atomic mass unit (mu = 1.66 × 10⁻²⁷ kg); Rn = 1.8 km is the effective radius of the nucleus; T0, Tgas, Tc, and Tmin are the surface temperature, the gas temperature at the distance where the grain terminal velocity is reached, the temperature at the sonic point, and the minimum gas temperature in the coma, respectively. In the present paper we use the values T0 = 200 K, Tgas = 100 K, Tc = 150 K, and Tmin = 50 K.
The gas and the dust grains reach their terminal velocities at a distance of about five cometary radii (Gombosi et al. 1986). In our particular scenario the gas and dust practically decouple from each other at about 10 km from the center of the nucleus. It is interesting to note that for particles with radii larger than about 10 nm, the terminal speed  . With these parameters we can solve for the grain terminal velocity as a function of grain size and obtain their kinetic energy (Fig. 2).
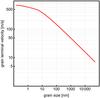 |
Fig. 2 Terminal velocity of the dust particles due to gas drag as a function of their size using Eqs. (3) through (5). |
4. Radiation pressure effects
After a dust grain is accelerated by the gas outflow the only relevant forces acting on it is radiation pressure, and – if the grain is charged – the electric force due to the motional electric field of the solar wind (in the coordinate system fixed to the nucleus of the comet). This is certainly true for reasonably short periods of time τ ≃ d/ḋ ≪ 30 days, where d is the heliocentric distance of the comet (see Mendis & Horányi 2013).
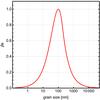 |
Fig. 3 Radiation pressure coefficient β from Eq. (7) setting β0 = 1 and a0 = 100 nm, capturing the characteristic behavior of ice/silica particles (Burns et al. 1979). |
The radiation pressure force is conveniently characterized by comparing it to the gravitational force of the Sun, F⊙ (as both of these scale as 1 /d2, βa remains independent of the distance from the Sun), 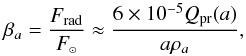 (6)where Qpr(a) is the size-dependent scattering efficiency for radiation pressure. In addition to the radius of the grain a, βa is a function of the material composition and of the surface properties of the grains (Burns et al. 1979). However, independent of their composition, for particles with radii a>a0 = 100 nm, Qpr approaches a constant (=0.25), hence βa ~ 1 /a (van de Hulst 1981). Here we use a simple heuristic expression for βa setting its maximum value β0 at a radius a0 and introducing y = a/a0 (see Fig. 3):
 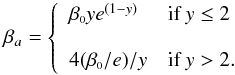 (7)The gas drag accelerated particles are slowed down and eventually turned around by radiation pressure, resulting in the so-called folding umbrella pattern of a cometary dust coma (Eddington 1910).
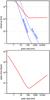 |
Fig. 4 Top panel: apex distance for particles launched near the Sun-comet axis (red line), and the displacement in the direction normal to the orbital plane of the comet due to the solar wind motional electric field (blue lines) discussed in Sect. 5. Lower panel: travel time to the apex distance as a function of grain size. |
As discussed in Section 3, for big particles the outflow speed goes as  , hence their kinetic energy KE ~ a2. For these grains the radiation pressure force Frad ~ F⊙ ~ a2, hence the apex distance of the particles moving close to the Sun-comet axis, dapex ~ KE/F⊙ is a constant, independent of a for a>a0. We note that the situation is more complicated since not all grains will have been ejected directly towards the Sun and a small deviation in this angle might result in a significant deviation when the particles return to the vicinity of the nucleus. The top panel in Fig. 4 shows the apex distance of a dust grain as a function of its size (red line). The travel time to reach their apex (see the lower panel in Fig. 4) is <10 days for particles with radii 30 nm <a< 1 μm. Particles with a< 10 nm, due their diminishing β, travel for a long time and reach distances dapex> 105 km, and due to charging (discussed below) and the orbital motion of the comet, are unlikely to return to the vicinity of the nucleus. Since the radiation pressure force is conservative, particles that remain intact will return to the vicinity of the comet with the same speed from the direction of the Sun, as they left due to gas drag towards the Sun.
All particles with a> 100 nm will reach a distance of ≃104 km. The observed energy range of 1−20 keV of nano-grains arriving from the direction of the Sun, is consistent with fragments in the size range of 30 <a< 80 nm of the larger particles that break apart near their common apex distance, where they spend most of their time, due to charging and/or loss of their volatile components. The observed nano-grains in the energy range of 200 to 500 eV moving towards the Sun are consistent with gas drag accelerated grains in the size range of 3−4 nm, perhaps the most abundant smallest particles escaping the comet (Fig. 5). The motional electric field in the solar wind (Sect. 5) and the size distribution of the fragments hold the key to explaining the range of sizes/energies of the recorded returning nano-grains.
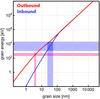 |
Fig. 5 Kinetic energy of dust particles as function of their size. The outbound particles (red line) gained their energy from gas drag and are moving away from the nucleus of comet 67P. The inbound particles (discussed in Sect. 4) are arriving from the direction of the Sun as a result of radiation pressure. These particles are the suggested break-up products of larger grains. |
5. Role of electric fields
The solar wind motional electric field acting on a cometary grain is 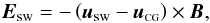 (8)where uCG is the velocity of the nucleus with respect of the Sun. At d ≈ 3.5 AU the velocity of the nucleus is about 16 km s-1 and is negligible compared to the solar wind speed of ≃400 km s-1. In this approximation the acceleration of a grain with charge qa is
 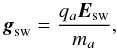 (9)where ma is the mass of a dust grain. Under nominal conditions both the solar wind velocity vector and the interplanetary magnetic field (IMF) vector are close to the comet’s orbital plane, hence, the acceleration of dust grains due to the solar wind motional electric field is perpendicular to the orbital plane. In August 2014 the Rosetta spacecraft was at d ≈ 3.5 AU and magnitude of the motional electric field can vary between Esw ≈ 0.01 mV/m and Esw ≈ 1 mV/m with a typical value of Esw ≈ 0.4 mV/m (values obtained with solar wind speeds ranging between 300 km s-1 and 500 km s-1, IMF magnitudes between 0.1 nT and 10 nT, and IMF angle of 75°). Here we consider nano-grains with a single negative charge, therefore the acceleration due to Esw is
 ![Mathematical equation: \begin{equation} g_{\rm sw}(a) \approx \pm 2.2\times10^{-5} \frac{E_{\rm sw}}{E_{{\rm sw}_\snull}} \frac{m_{a_\snull}}{m_a} \quad{\rm \left[m/s^2\right]} \label{eq:Efield3} , \end{equation}](/articles/aa/full_html/2015/11/aa26316-15/aa26316-15-eq84.png) (10)where Esw0 = 0.4 mV/m is the nominal motional electric field and ma0 is the mass of a particle of size a0. The displacement of singly charged nano-grains due to the motional solar wind electric field during the return trip of the daughter fragments of larger particles is shown in Fig. 4. The two blue curves in Fig. 4 represent two extremes of the motional electric field: the dashed line corresponds to Esw = 0.01 mV/m, while the dotted line corresponds to Esw = 1 mV/m. Inspection of Fig. 4 reveals that in the case of a weak motional electric field, particles with a< 100 nm can return to within 50 km of the nucleus. In the case of a large motional electric field, only larger particles (with large kinetic energies) can return to the vicinity of the nucleus, possibly explaining the intermittent nature of the detection of 1−20 keV negatively charged grains.
(10)where Esw0 = 0.4 mV/m is the nominal motional electric field and ma0 is the mass of a particle of size a0. The displacement of singly charged nano-grains due to the motional solar wind electric field during the return trip of the daughter fragments of larger particles is shown in Fig. 4. The two blue curves in Fig. 4 represent two extremes of the motional electric field: the dashed line corresponds to Esw = 0.01 mV/m, while the dotted line corresponds to Esw = 1 mV/m. Inspection of Fig. 4 reveals that in the case of a weak motional electric field, particles with a< 100 nm can return to within 50 km of the nucleus. In the case of a large motional electric field, only larger particles (with large kinetic energies) can return to the vicinity of the nucleus, possibly explaining the intermittent nature of the detection of 1−20 keV negatively charged grains.
6. Charging of nano-dust particles
The nano-dust particles detected by RPC-IES carried a negative charge, contrary to our expectation of positively charged particles in interplanetary space where charging is dominated by UV induced photoelectron production; this typically results in a surface potential φ ≃ + 5V, independent of the size. The charge of a particle Q ~ aφ, and its charging time to reach its equilibrium potential τQ ~ Q/J, with J the photoelectron current, resulting in τQ ~ 1 /a ≃ 2 min /(1 μm) at d = 1 AU (Horanyi 1996). Hence even for a 100 nm sized particle at 3.5 AU, with all charging current ~1 /d2, τQ ≃ 0.2 days, which is shorter than the characteristic trip time of t ≃ 1 day to return from their apex to the comet. For smaller particles t becomes comparable to or even longer than τQ. If during the breakup both positively and negatively charged particles are generated, we expect a non-negligible fraction to arrive back at the comet preserving their negative initial charges. This of course begs the question of the lack of detections of positively charged nano-dust particles. We suggest that this is likely an instrumental effect, as particles that directly deliver surplus electrons to the instrument’s micro-channel plate could more efficiently start an electron avalanche that is able to be detected.
In addition to Esw, electric fields also emerge on the surface of the nucleus and could contribute to the acceleration of nano-dust particles (Szegő et al. 2014). Ignoring cometary outgassing, the effects of surface electric fields can be quickly estimated to show that their contribution to the energization of negatively charged nano-dust grains is expected to remain negligible.
On the dayside, the released photoelectrons generate an electric field pointing away from the surface. The typical energy of the photoelectrons is on the order of 2 eV, and the surface potential φs ≃ + 5 V, resulting in a sun-pointing electric field Es ≃ φs/λD, where λD is the Debye length of the photoelectron sheath over the surface of the nucleus. While φs remains independent of d, λD ≃ 1 m·d, increases as a result of the drop in the UV flux reaching the surface that sustains the density of photoelectrons. Hence, at 3.5 AU the electric field on the sunlit-side of the nucleus is on the order of Ed ≃ 3 V/m, extending to a distance on the order of λD ≃ 3−4 m. Hence, for positively charged nano-dust particles the energy gain is <10 eV from the dayside sheath electric field.
The nightside of the nucleus could charge to surface potentials φs that are several hundreds of volts negative (Mendis et al. 1981). However, the electric field points toward the surface, hence negatively charged nano-dust particles will be accelerated in the antisolar direction, and cannot reach Rosetta.
Finally, electric fields are also generated near the boundaries of lit-dark regions where differential charging can result in surprisingly intense, but very small-scale surface electric fields pointing from the lit towards the unlit regions (Wang et al. 2007). The evaluation of these “terminator” fields remains difficult without understanding the large- and small-scale topography of the nucleus. However, the dedicated search by the Lunar Atmosphere and Dust Environment Explorer (LADEE) found no evidence of small particles lofted above the lunar terminator regions (Horanyi et al. 2015).
7. Conclusion
While there are a large number of uncertainties in the physical properties of small cometary dust particles, using a reasonable set of assumptions, their dynamics near the comet can possibly explain the RPC/IES observations. Until early 2015, 67P was a weakly outgassing comet, and while in general the subsolar regions of its nucleus are the most active, the comet’s outgassing remains patchy, and the escaping dust plumes remain narrow. As the nucleus slowly rotates with a period of about 12 h, the geometry of the dust plumes is likely to miss Rosetta, and only intermittently sweep over it.
Near the nucleus, the photo-ionized neutral gas can sufficiently increase the electron density to generate negatively charged dust particles. The observed energy range of 200−500 eV corresponds to the kinetic energy of nano-dust particles with radii in the approximate range of 3−4 nm. The fact that the beam of negatively charged “outbound” particles is intermittent and nearly mono-energetic is probably associated with a local peak in the grain size distribution. These few nm sized grains contain about 104 water molecules and they probably represent the basic building blocks of the larger “fluffy” grains. It is worth mentioning that the nano-grain size distribution in the plume of Enceladus has a peak around 104 water molecules (Hill et al. 2012) (even though the physical processes responsible for the icy grain formation are probably different at Enceladus and 67P). The observed flux of outbound grains is quite low and the peak at a size of 3−4 nm barely rises above the IES instrument threshold. This peak explains the nearly mono-energetic nature of the outbound flux.
The more energetic 1−20 keV particles arriving from the solar direction are likely the breakup products of larger particles that disintegrated near their apex distance, and are accelerated back towards Rosetta by radiation pressure. Particles with radii in the range of 30−80 nm return in the observed energy range. The solar-wind motional electric field will, in general, accelerate these particles in the direction perpendicular to the orbital plane of the comet that lies near the ecliptic plane (inclination ≃7°). Most of the time they will miss 67P with more than 100 km, hence Rosetta can only intermittently detect them during periods of slow solar wind speeds and/or when the azimuthal component of the interplanetary magnetic field is smaller than average, a combination that results in a weaker solar wind motional electric field.
In the coming months, as the comet approaches perihelion, its gas and dust production will increase. While the gas density is expected to increase dramatically, the gas outflow velocity will remain approximately constant (see Gombosi et al. 1986). Higher gas densities result in more efficient drag acceleration, causing larger and larger particles to reach the characteristic gas terminal speed of about 700 m/s. We expect the outflowing nano-grain population in the size range of 3−5 nm to remain observable and to arrive at Rosetta with the same narrow energy range
of 200−500 eV. Because of the increase in cometary activity, they will likely be recorded with increasing frequency.
However, as larger particles approach the gas terminal speed and gain more energy, their apex distance will grow. During the increased time of their return trip they will move farther away from the comet’s orbital plane because of the solar wind motional electric field. This effect will be even more enhanced by the increase of the average motional electric field. Hence, even larger (and fewer) particles than the 30−80 nm radius grains reported here will return to the vicinity of the nucleus. We expect the energy range of the returning particles to increase, but the frequency of their detection to drop, or possibly to vanish entirely.
Acknowledgments
This research was supported by NASA under contracts JPL-1266313 at the University of Michigan, JPL-1345493 at the Southwest Research Institute, and JPL-1502225 at the University of Colorado. Rosetta is an ESA mission with contributions from its member states and NASA.
References
- Broiles, T. W., Burch, J. L., Clark, G. B., et al. 2015, A&A, 583, A21 [NASA ADS] [CrossRef] [EDP Sciences] [Google Scholar]
- Burch, J. L., Cravens, T. E., Llera, K., et al. 2015, Geophys. Res. Lett., 42, 5125 [NASA ADS] [CrossRef] [Google Scholar]
- Burns, J. A., Lamy, P. L., & Soter, S. 1979, Icarus, 40, 1 [NASA ADS] [CrossRef] [Google Scholar]
- Carr, C., Cupido, E., Lee, C. G. Y., et al. 2007, Space Sci. Rev., 128, 629 [NASA ADS] [CrossRef] [Google Scholar]
- Clark, G., Broiles, T. W., Burch, J. L., et al. 2015, A&A, 583, A24 [NASA ADS] [CrossRef] [EDP Sciences] [Google Scholar]
- Eddington, A. S. 1910, MNRAS, 70, 442 [NASA ADS] [Google Scholar]
- Fuselier, S. A., Altwegg, K., Balsiger, H., et al. 2015, A&A, 583, A2 [NASA ADS] [CrossRef] [EDP Sciences] [Google Scholar]
- Glassmeier, K.-H., Boehnhardt, H., Koschny, D., Kührt, E., & Richter, I. 2007, Space Sci. Rev., 128, 1 [NASA ADS] [CrossRef] [Google Scholar]
- Gombosi, T. I., Nagy, A. F., & Cravens, T. E. 1986, Rev. Geophys., 24, 667 [NASA ADS] [CrossRef] [Google Scholar]
- Hill, T. W., Thomsen, M. F., Tokar, R. L., et al. 2012, J. Geophys. Res., 117, A05209 [NASA ADS] [Google Scholar]
- Horanyi, M. 1996, ARA&A, 34, 383 [NASA ADS] [CrossRef] [Google Scholar]
- Horanyi, M., Szalay, J., Kempf, S., et al. 2015, in Lunar and Planetary Science Conf., 46, 1684 [Google Scholar]
- Jones, G. H., Arridge, C. S., Coates, A. J., et al. 2009, Geophys. Res. Lett., 36, L16204 [NASA ADS] [CrossRef] [Google Scholar]
- Mendis, D. A., & Horányi, M. 2013, Rev. Geophys., 51, 53 [Google Scholar]
- Mendis, D. A., Hill, J. R., Houpis, H. L. F., & Whipple, E. C. 1981, ApJ, 249, 787 [NASA ADS] [CrossRef] [Google Scholar]
- Nilsson, H., Stenberg Wieser, G., Behar, E., et al. 2015, A&A, 583, A20 [NASA ADS] [CrossRef] [EDP Sciences] [Google Scholar]
- Protopapa, S., Sunshine, J. M., Feaga, L. M., et al. 2014, Icarus, 238, 191 [NASA ADS] [CrossRef] [Google Scholar]
- Rotundi, A., Sierks, H., Della Corte, V., et al. 2015, Science, 347, aaa3905 [Google Scholar]
- Schulz, R., Hilchenbach, M., Langevin, Y., et al. 2015, Nature, 518, 216 [NASA ADS] [CrossRef] [Google Scholar]
- Szegő, K., Juhász, A., & Bebesi, Z. 2014, Planet. Space Sci., 99, 48 [NASA ADS] [CrossRef] [Google Scholar]
- van de Hulst, H. 1981, Light Scattering by Small Particles (New York: Dover) [Google Scholar]
- Wang, X., Horányi, M., Sternovsky, Z., Robertson, S., & Morfill, G. E. 2007, Geophys. Res. Lett., 34, 16104 [NASA ADS] [Google Scholar]
All Figures
|
Fig. 1 Contour plot of log(counts) on a polar log(Energy)−log(Energy) diagram for the time period 0500−0600 UT on August 25, 2014. The top (Sun) segments 7−11 indicate the 1−20 keV nano-dust population arriving from the approximate direction of the Sun canted away in the direction of the orbital motion of comet 67P. At the bottom (67P) segments 0−14 are the ~200−500 eV negative particles. The polar plot indicates the arrival angles of the particles in the instrument frame of reference (Burch et al. 2015). |
| In the text | |
|
Fig. 2 Terminal velocity of the dust particles due to gas drag as a function of their size using Eqs. (3) through (5). |
| In the text | |
|
Fig. 3 Radiation pressure coefficient β from Eq. (7) setting β0 = 1 and a0 = 100 nm, capturing the characteristic behavior of ice/silica particles (Burns et al. 1979). |
| In the text | |
|
Fig. 4 Top panel: apex distance for particles launched near the Sun-comet axis (red line), and the displacement in the direction normal to the orbital plane of the comet due to the solar wind motional electric field (blue lines) discussed in Sect. 5. Lower panel: travel time to the apex distance as a function of grain size. |
| In the text | |
|
Fig. 5 Kinetic energy of dust particles as function of their size. The outbound particles (red line) gained their energy from gas drag and are moving away from the nucleus of comet 67P. The inbound particles (discussed in Sect. 4) are arriving from the direction of the Sun as a result of radiation pressure. These particles are the suggested break-up products of larger grains. |
| In the text | |
Current usage metrics show cumulative count of Article Views (full-text article views including HTML views, PDF and ePub downloads, according to the available data) and Abstracts Views on Vision4Press platform.
Data correspond to usage on the plateform after 2015. The current usage metrics is available 48-96 hours after online publication and is updated daily on week days.
Initial download of the metrics may take a while.