Fig. 1
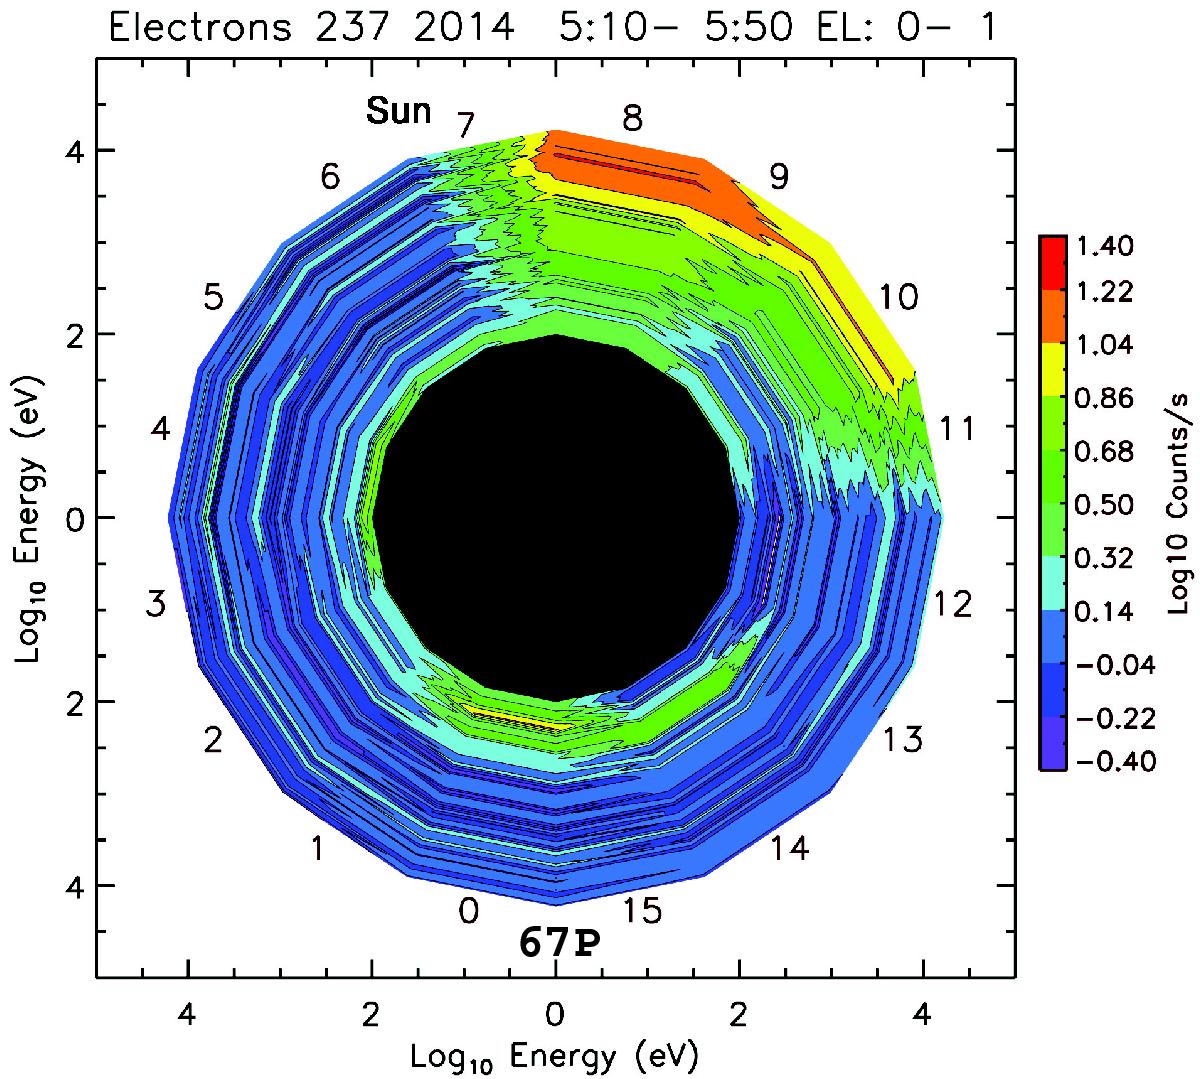
Contour plot of log(counts) on a polar log(Energy)−log(Energy) diagram for the time period 0500−0600 UT on August 25, 2014. The top (Sun) segments 7−11 indicate the 1−20 keV nano-dust population arriving from the approximate direction of the Sun canted away in the direction of the orbital motion of comet 67P. At the bottom (67P) segments 0−14 are the ~200−500 eV negative particles. The polar plot indicates the arrival angles of the particles in the instrument frame of reference (Burch et al. 2015).
Current usage metrics show cumulative count of Article Views (full-text article views including HTML views, PDF and ePub downloads, according to the available data) and Abstracts Views on Vision4Press platform.
Data correspond to usage on the plateform after 2015. The current usage metrics is available 48-96 hours after online publication and is updated daily on week days.
Initial download of the metrics may take a while.