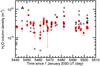
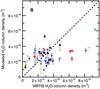
Fig. 13

Column densities from the DSMC model compared to VIRTIS-H column densities. A): model results (red) and measurements (black) are plotted as a function of time. B): model as a function of measurements, with the same color coding as in Fig. 7, corresponding to regions in P1. Modeled columns have been multiplied by a factor 0.8 to approximate the column density of H2O. The markers for the model are at the average point between the values found at the start and stop time of a given observation, which themselves give the error bars. The error bars for VIRTIS-H measurements are shown in Fig. 6.
Current usage metrics show cumulative count of Article Views (full-text article views including HTML views, PDF and ePub downloads, according to the available data) and Abstracts Views on Vision4Press platform.
Data correspond to usage on the plateform after 2015. The current usage metrics is available 48-96 hours after online publication and is updated daily on week days.
Initial download of the metrics may take a while.