Fig. 8
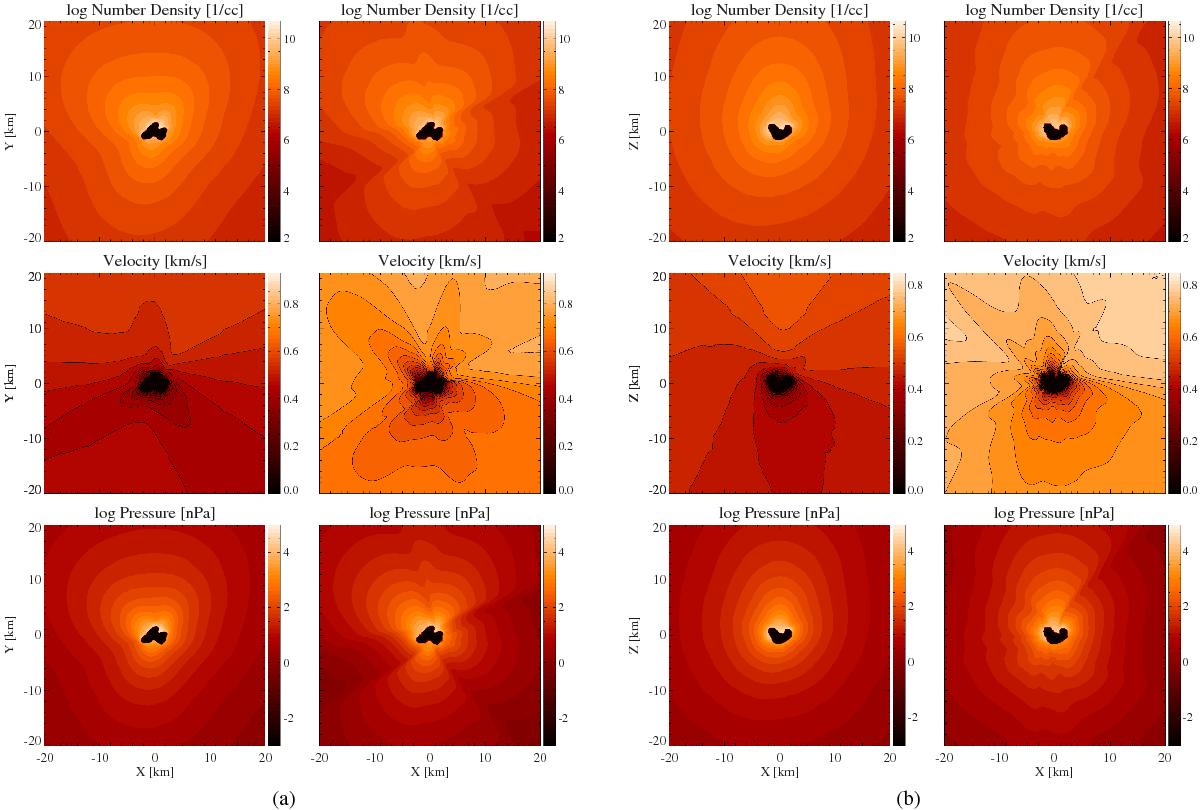
AMPS and BATS-R-US comparison for number density, velocity and pressure. Panel a) corresponds to the z = 0 plane in the comet centered coordiante system and b) to the plane with y = 0. The simulated Sun position in all figures is on the positive y-axis at x = 0 km. On the left hand side of each panel we show results from AMPS and on the right hand side from BATS-R-US. For BATS-R-US, there are structures in the number density and pressure profiles which are not seen for AMPS. Gas velocities produced by AMPS are in better agreement with the velocity of 0.68 km s-1 reported by Gulkis et al. (2015). Both methods produce asymmetric number density and velocity profiles with higher abundances and velocities on the hemisphere pointed towards the Sun.
Current usage metrics show cumulative count of Article Views (full-text article views including HTML views, PDF and ePub downloads, according to the available data) and Abstracts Views on Vision4Press platform.
Data correspond to usage on the plateform after 2015. The current usage metrics is available 48-96 hours after online publication and is updated daily on week days.
Initial download of the metrics may take a while.