Fig. 7
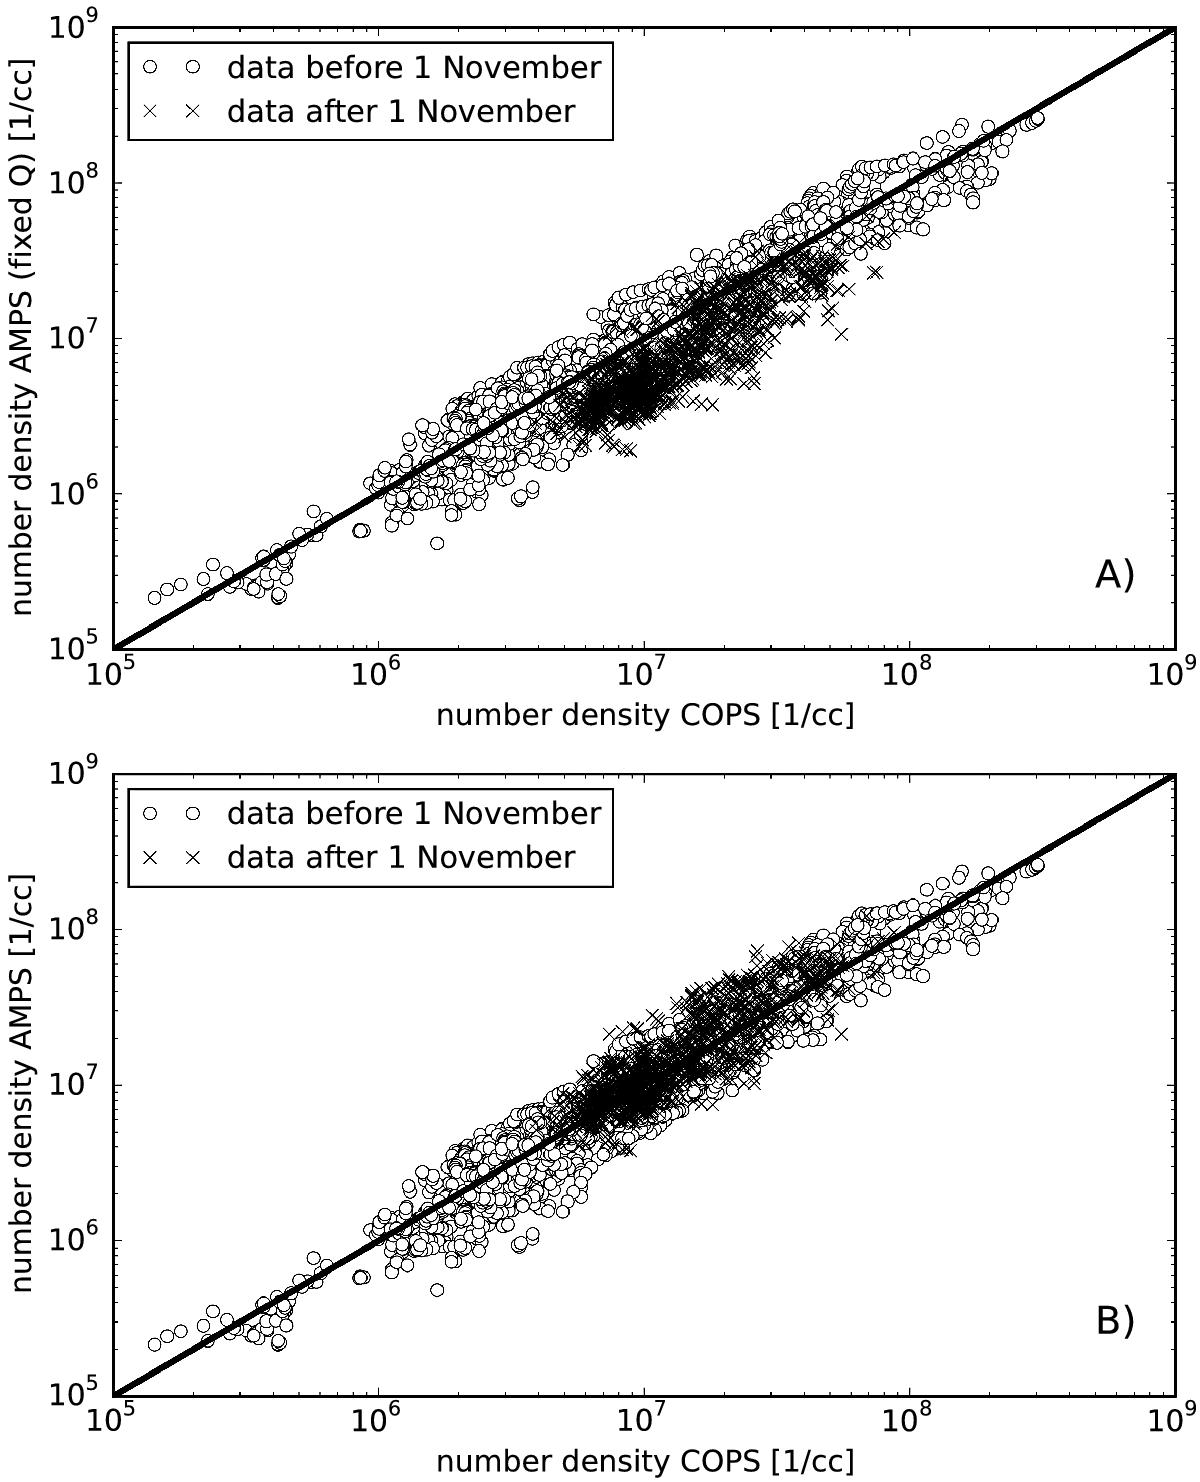
Two scatter plots showing the correlation between AMPS results and COPS measurements. For panel A) the production rate Q is assumed constant over the whole time period of 2014. Clearly all simulation results after 1 November then underestimate the observations. Panel B) shows the AMPS results if we take into account an increase in the production rate of a factor of 2, leading to better agreement.
Current usage metrics show cumulative count of Article Views (full-text article views including HTML views, PDF and ePub downloads, according to the available data) and Abstracts Views on Vision4Press platform.
Data correspond to usage on the plateform after 2015. The current usage metrics is available 48-96 hours after online publication and is updated daily on week days.
Initial download of the metrics may take a while.