Free Access
Fig. 6
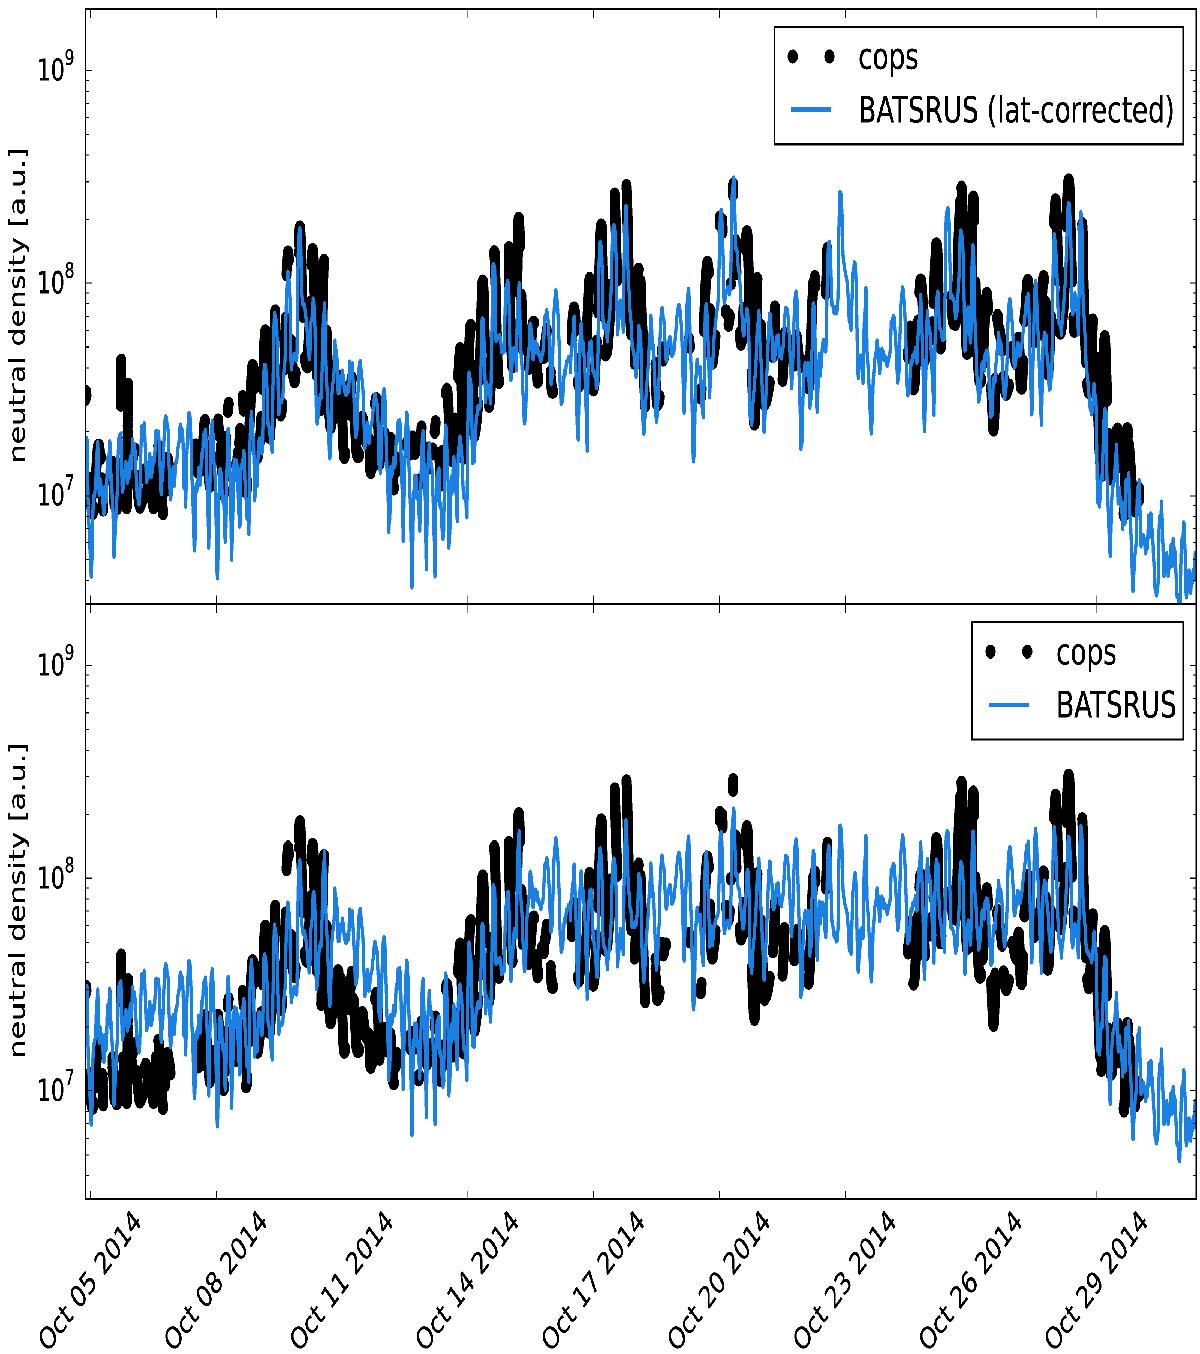
The effect of the latitude correction shown for BATS-R-US model results. The top panel shows the increased agreement with the COPS observations after applying the correction. In this figure none of the signals is filtered or smoothed in any way, hence the diurnal variations are clearly noticeable.
Current usage metrics show cumulative count of Article Views (full-text article views including HTML views, PDF and ePub downloads, according to the available data) and Abstracts Views on Vision4Press platform.
Data correspond to usage on the plateform after 2015. The current usage metrics is available 48-96 hours after online publication and is updated daily on week days.
Initial download of the metrics may take a while.