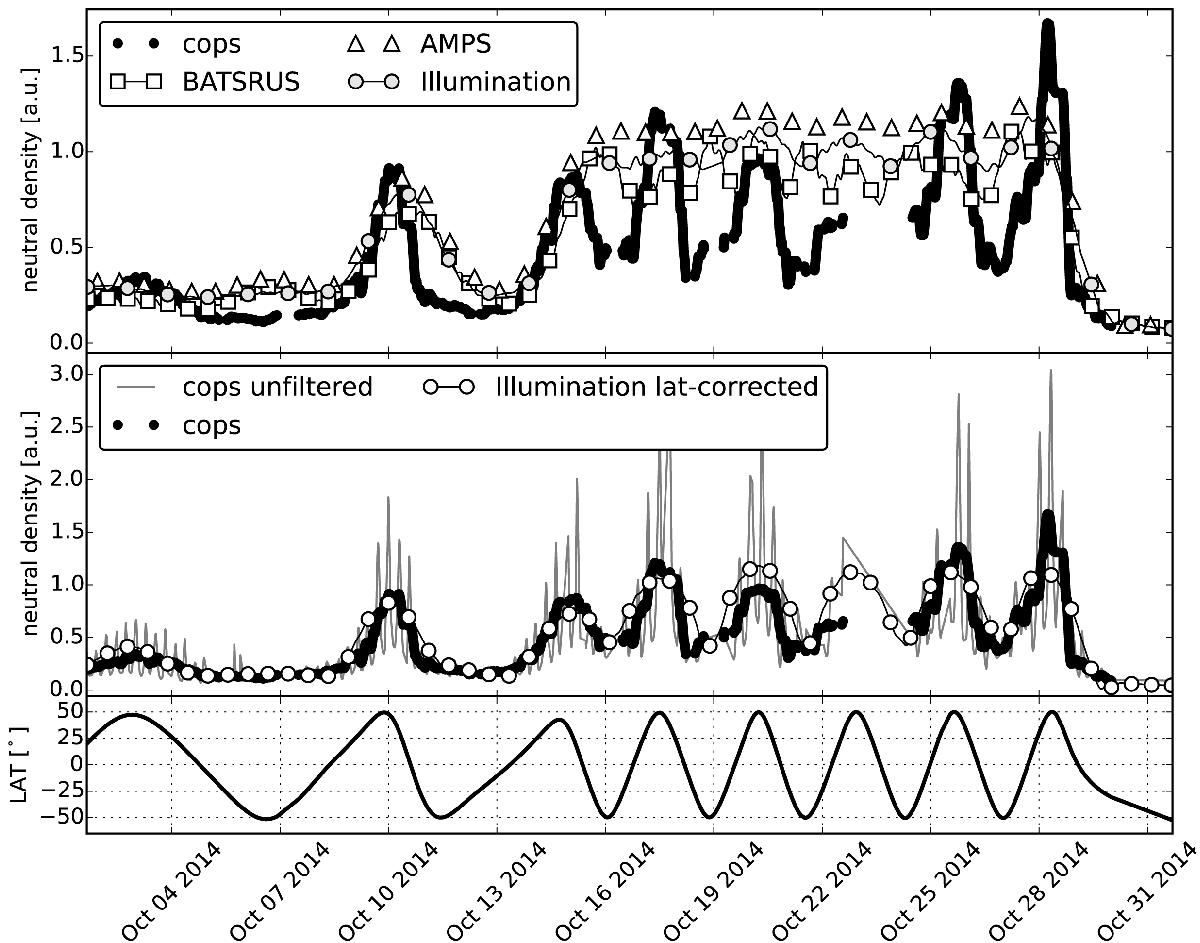
Fig. 5

Top panel: smoothed COPS and all model data. Clearly the models are not able to reproduce the large scale variations observed. Between October 13 and 26 the model average is more or less a horizontal line with little variation over time. Bottom panel: smoothed and original COPS data together with smoothed illumination model data with applied latitude correction. The fit between the large scale features and the model is significantly increased. The same applies for averaged AMPS and BATS-R-US data which are not shown in this plot.
Current usage metrics show cumulative count of Article Views (full-text article views including HTML views, PDF and ePub downloads, according to the available data) and Abstracts Views on Vision4Press platform.
Data correspond to usage on the plateform after 2015. The current usage metrics is available 48-96 hours after online publication and is updated daily on week days.
Initial download of the metrics may take a while.


