Fig. 3
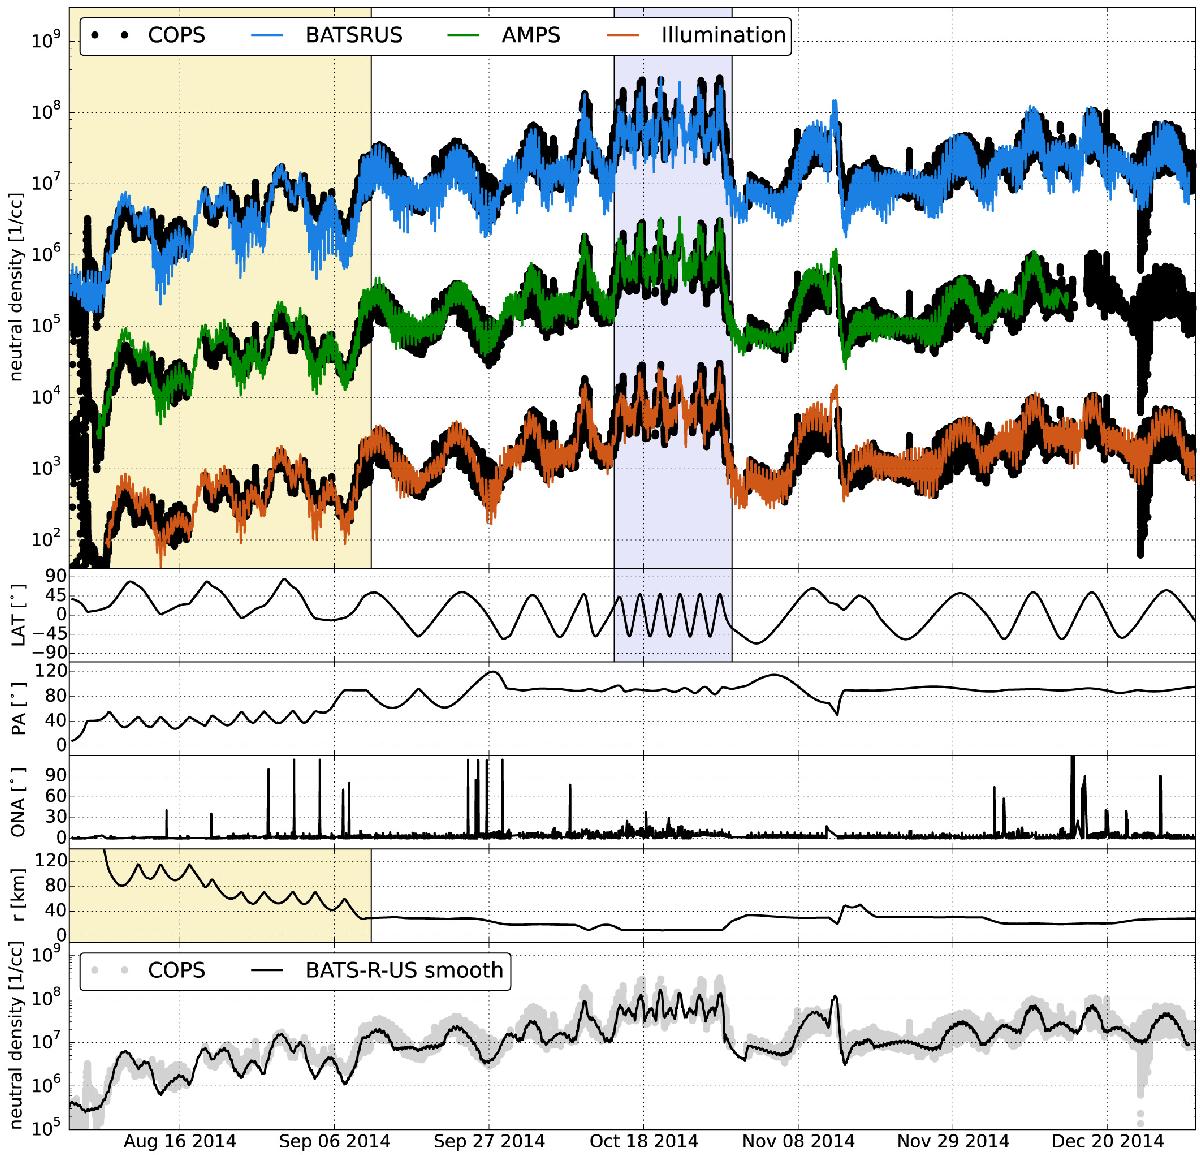
Overview of the model results and comparison to COPS data. In this figure all model results do include correction factors for an increasing activity and latitudinal effects, described in Sects. 3.3 and 3.4. The top panel shows neutral density measurements as full black circles. For sake of visual clarity the COPS data is drawn in units of molecules/cm3 only for the comparison with BATS-R-US. Model results and data are scaled by 2 or 4 orders of magnitude, respectively, for comparison with AMPS and the Illumination model. All model results follow the large scale trends of the COPS measurements for the full dataset. The approximately 600 diurnal variations cannot be resolved in this image. The next 4 panels from the top show information on s/c attitude and position relative to 67P and the Sun, with LAT being the latitude of the s/c position radially projected onto the nucleus in degrees. The phase angle (PA) is defined as the angle Sun-67P-Rosetta, and also given in degrees. Finally ONA stands for off-nadir-angle, measured as the angle between the s/c z-axis and the vector pointing to the center of mass of the nucleus. The light yellow box marks a period where the COPS signal is mostly driven by the change in distance between Rosetta and 67P. For data in the light purple box the main driver for the large scale features are changes in latitude, while cometocentric distance (r), and phase angle remain relatively stable. The bottom panel shows COPS data and BATS-R-US data with smoothed out diurnal variations as described in Sect. 3.2.
Current usage metrics show cumulative count of Article Views (full-text article views including HTML views, PDF and ePub downloads, according to the available data) and Abstracts Views on Vision4Press platform.
Data correspond to usage on the plateform after 2015. The current usage metrics is available 48-96 hours after online publication and is updated daily on week days.
Initial download of the metrics may take a while.