Fig. 5
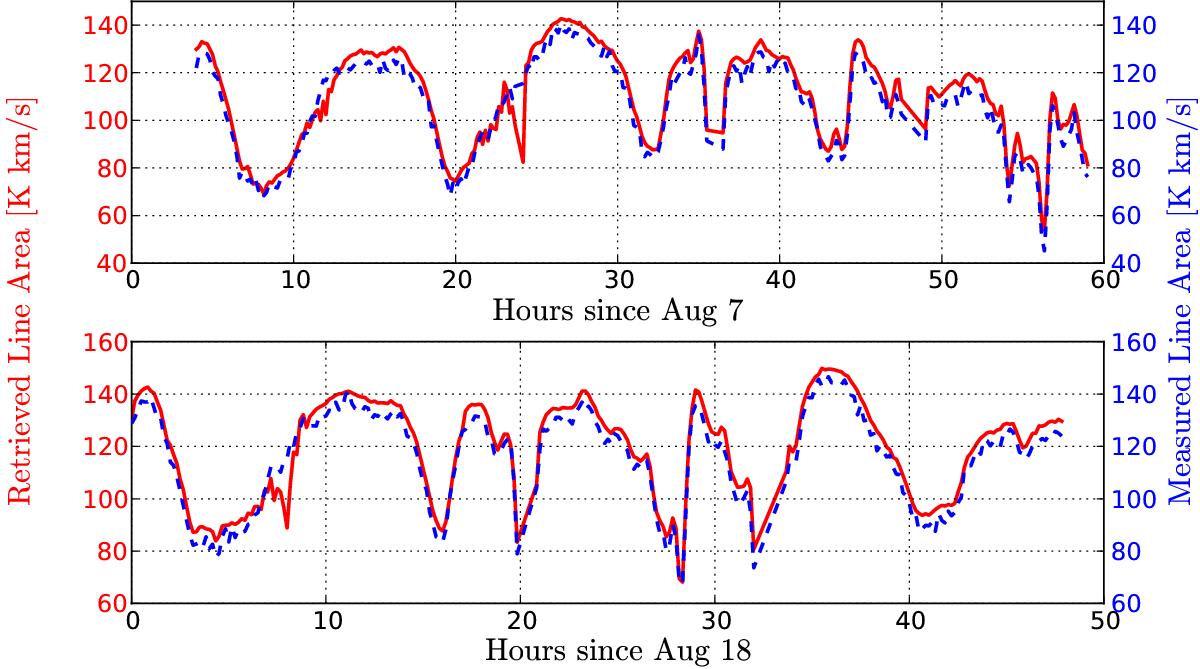
Time series of the retrieved line area (red solid line) compared with the measured line area (blue dashed line). Overall, the agreement is good. The small deviations in the line area for some cases (e.g. 24 h since 0 h on August 7 and 8 h since 0 h on August 18) can be traced back to a complex observed line shape, which cannot be reproduced with the parameterized coma model used in this study.
Current usage metrics show cumulative count of Article Views (full-text article views including HTML views, PDF and ePub downloads, according to the available data) and Abstracts Views on Vision4Press platform.
Data correspond to usage on the plateform after 2015. The current usage metrics is available 48-96 hours after online publication and is updated daily on week days.
Initial download of the metrics may take a while.