Fig. 2
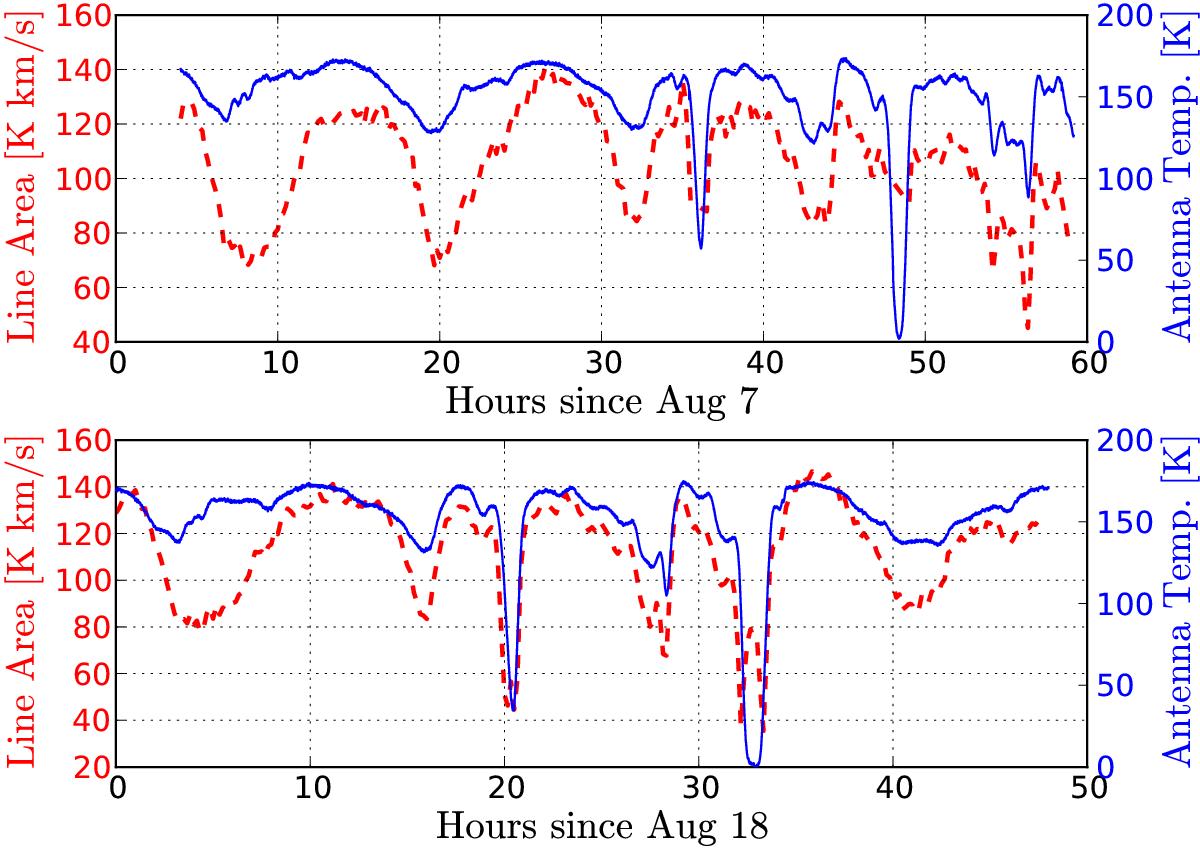
Time series of the submillimeter receiver antenna temperature and H![]() O spectral line area measured during the MIRO nadir observations on August 7−9 and August 18−19. The blue solid line is the antenna temperature in K, and the red dashed line is the spectral line area in K km s-1. The origin of the time axes are 0 h on August 7, 2014, and August 18, 2014 for the two panels, respectively.
O spectral line area measured during the MIRO nadir observations on August 7−9 and August 18−19. The blue solid line is the antenna temperature in K, and the red dashed line is the spectral line area in K km s-1. The origin of the time axes are 0 h on August 7, 2014, and August 18, 2014 for the two panels, respectively.
Current usage metrics show cumulative count of Article Views (full-text article views including HTML views, PDF and ePub downloads, according to the available data) and Abstracts Views on Vision4Press platform.
Data correspond to usage on the plateform after 2015. The current usage metrics is available 48-96 hours after online publication and is updated daily on week days.
Initial download of the metrics may take a while.