Fig. 14
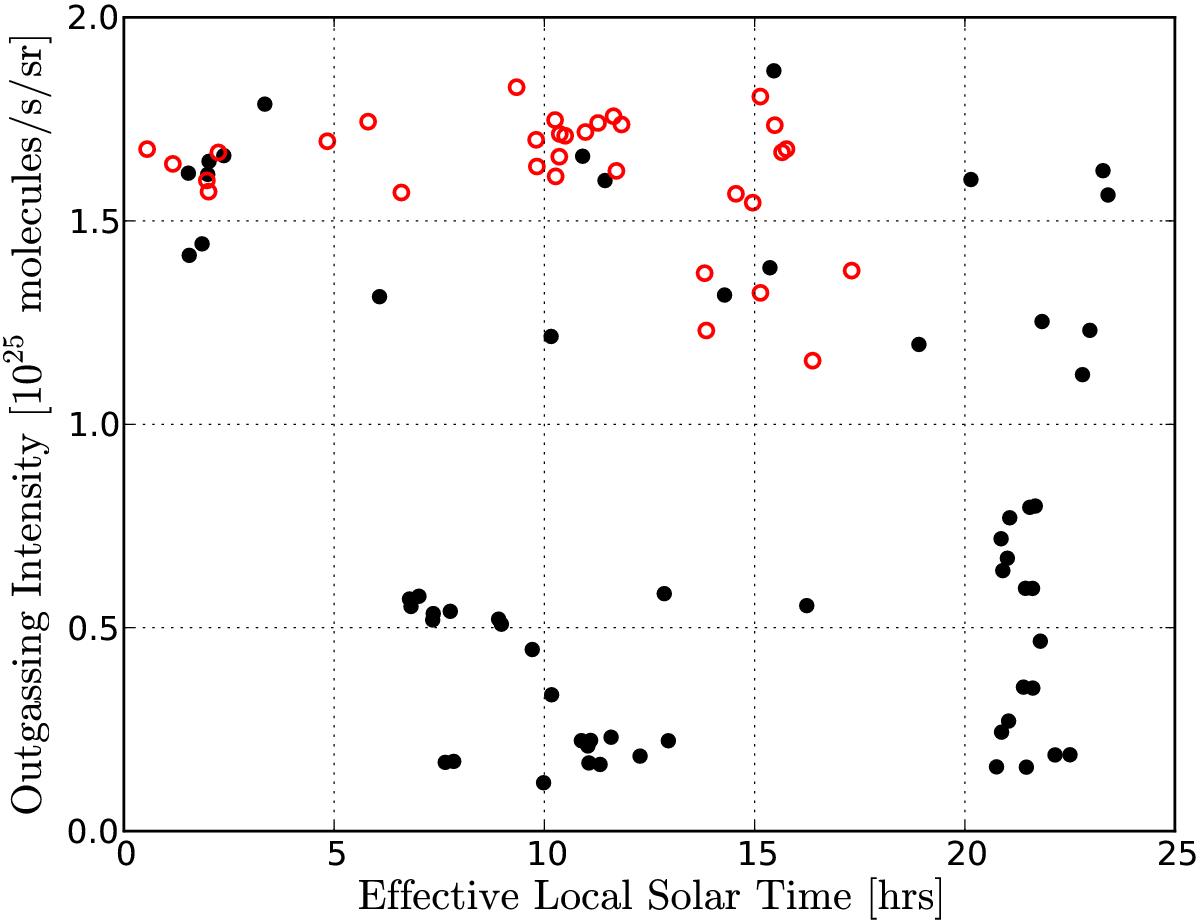
Distribution of the outgassing intensity with respect to the effective local solar time for the measurement from the body of the nucleus with the latitude lower than 60°N. The data are divided into two groups with respect to the emission angle of the measurement. The red open circle group represents the data with an emission angle smaller than 40°. The black filled circle group represents the data with an emission angle larger than 40°. The emission angle is the angle between the direction of the MIRO line of sight and the direction normal to the plate where the MIRO beam intercepts the shape. The larger the emission angle, the weaker the effect on the measurement by the local outgassing activity at the MIRO beam location.
Current usage metrics show cumulative count of Article Views (full-text article views including HTML views, PDF and ePub downloads, according to the available data) and Abstracts Views on Vision4Press platform.
Data correspond to usage on the plateform after 2015. The current usage metrics is available 48-96 hours after online publication and is updated daily on week days.
Initial download of the metrics may take a while.