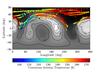
Fig. 1
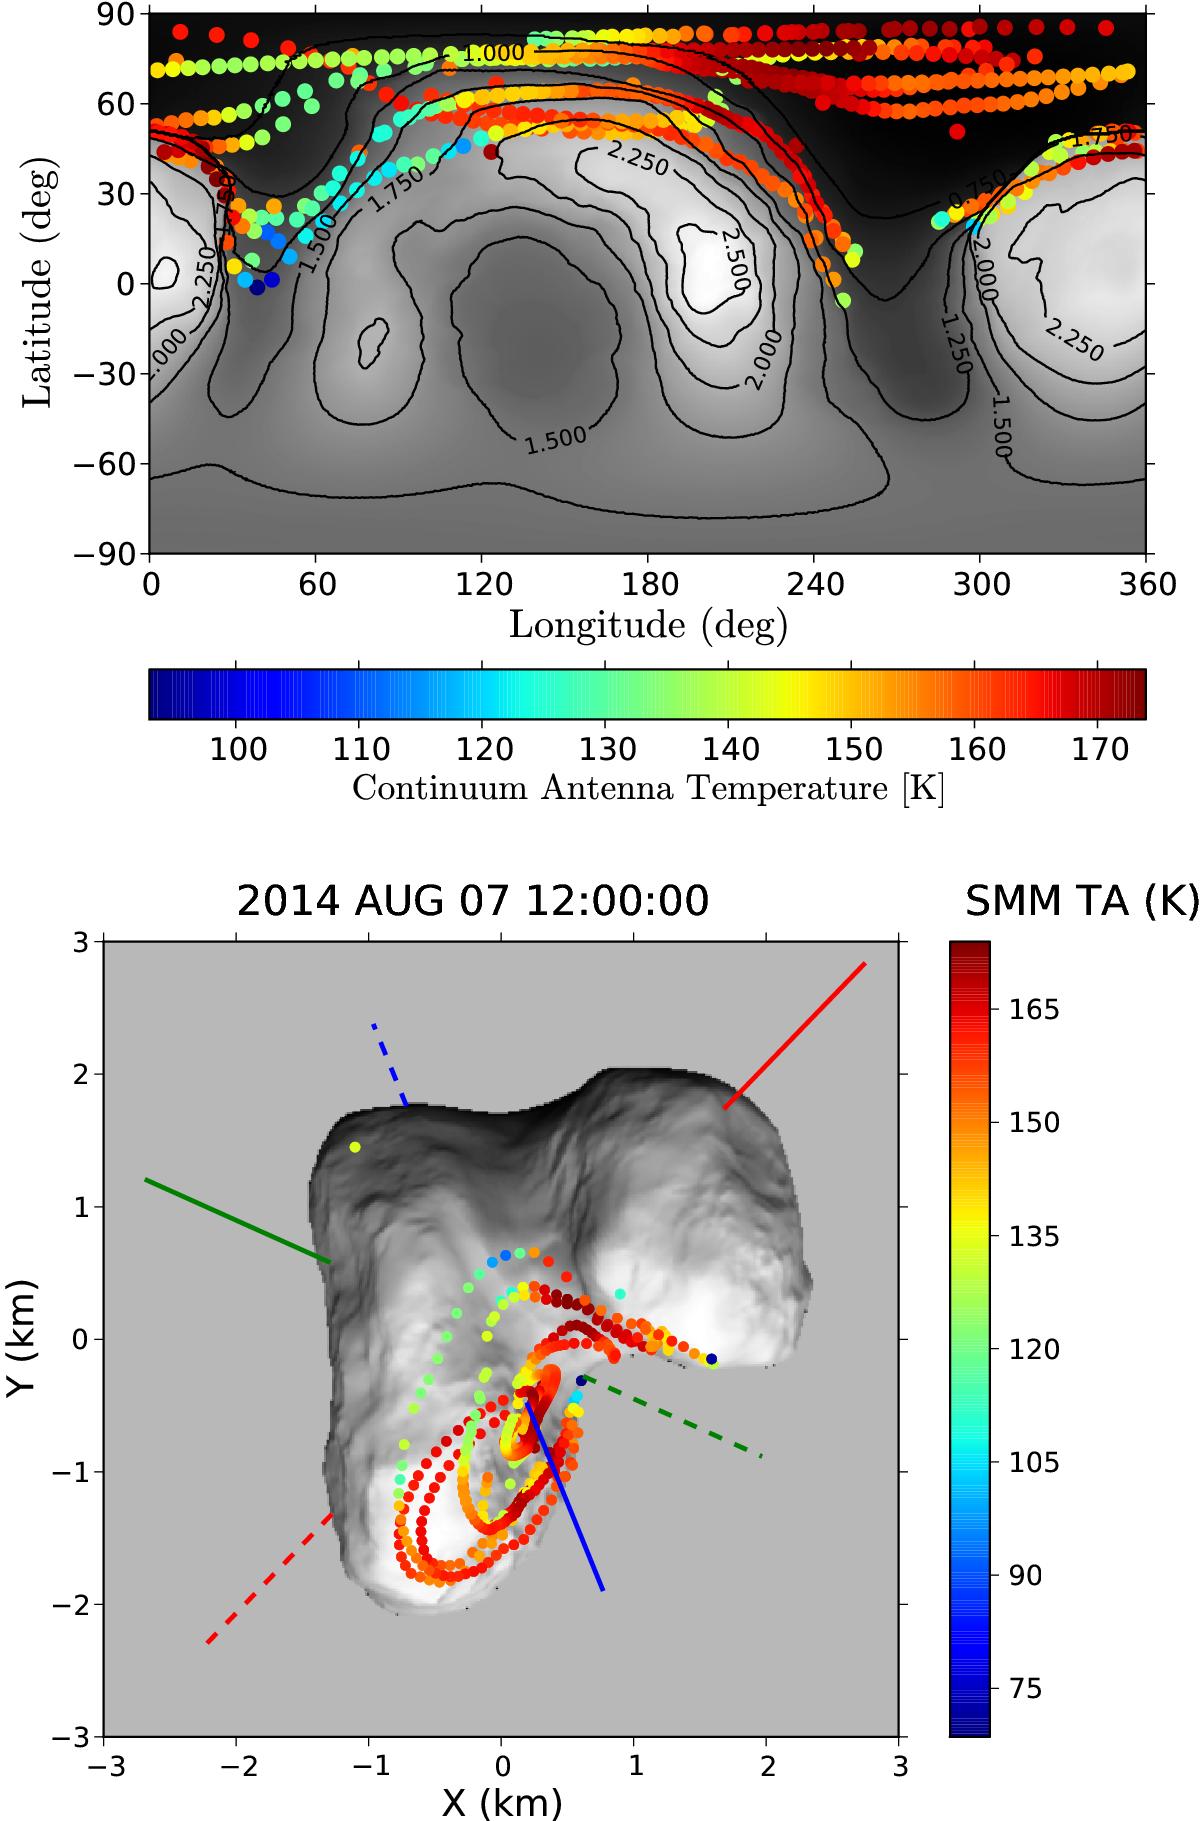
Ground-track of MIRO submillimeter beam during the two steady nadir-pointing observations in August 7−9 and August 18−19 in the latitude-longitude map (top panel) and the 3D nucleus shape (bottom panel). Each circle shows the mean location for a period of 10 min. The color of the circle gives the MIRO submillimeter continuum receiver antenna temperature, which is related to the subsurface temperature of the nucleus at the time of observation (Gulkis et al. 2015). The gray contour plots the elevation from the nucleus center of mass in the top panel and the mean illumination in the bottom panel.
Current usage metrics show cumulative count of Article Views (full-text article views including HTML views, PDF and ePub downloads, according to the available data) and Abstracts Views on Vision4Press platform.
Data correspond to usage on the plateform after 2015. The current usage metrics is available 48-96 hours after online publication and is updated daily on week days.
Initial download of the metrics may take a while.