Fig. 9
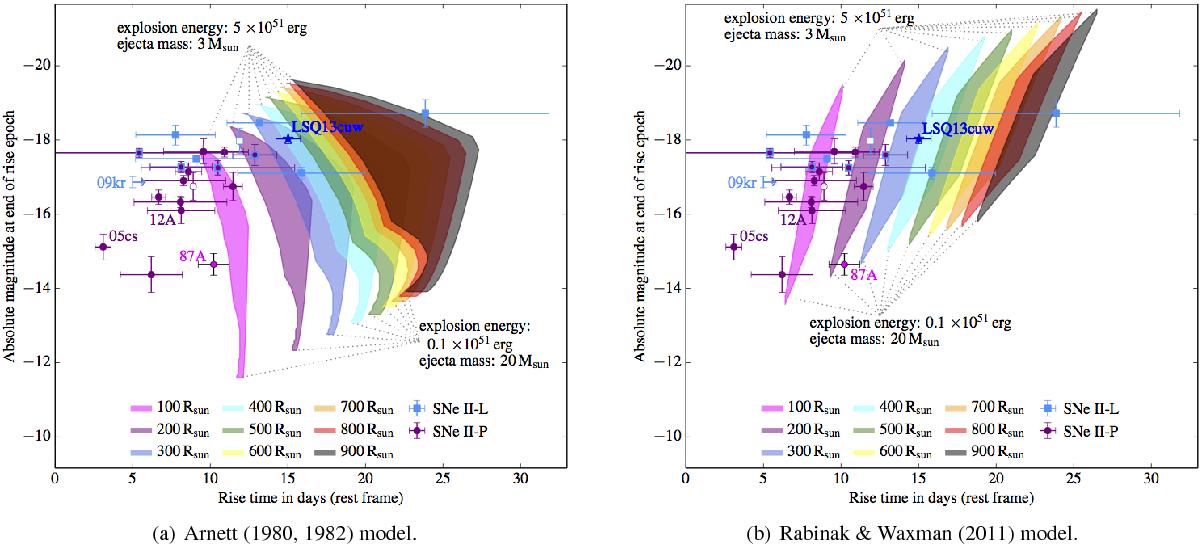
Theoretical rise times and end rise absolute magnitudes using the Arnett (1980, 1982) and Rabinak & Waxman (2011) model compared with the SNe in our sample. The SNe are depicted in the same way as in Fig. 8. The shaded regions represent the parameter space for specific progenitor radii, respectively. The input parameters were varied as follows: 100 R⊙ ≤ R0 ≤ 900 R⊙, 0.1 × 1051 erg ≤ E ≤ 5 × 1051 erg and 3 ≤ M ≤ 20 M⊙. The same rise time fitting algorithm was applied to the model optical light curves as was previously applied to the SN data. Only those objects that have progenitor detections are labelled explicitly.
Current usage metrics show cumulative count of Article Views (full-text article views including HTML views, PDF and ePub downloads, according to the available data) and Abstracts Views on Vision4Press platform.
Data correspond to usage on the plateform after 2015. The current usage metrics is available 48-96 hours after online publication and is updated daily on week days.
Initial download of the metrics may take a while.