Fig. 8
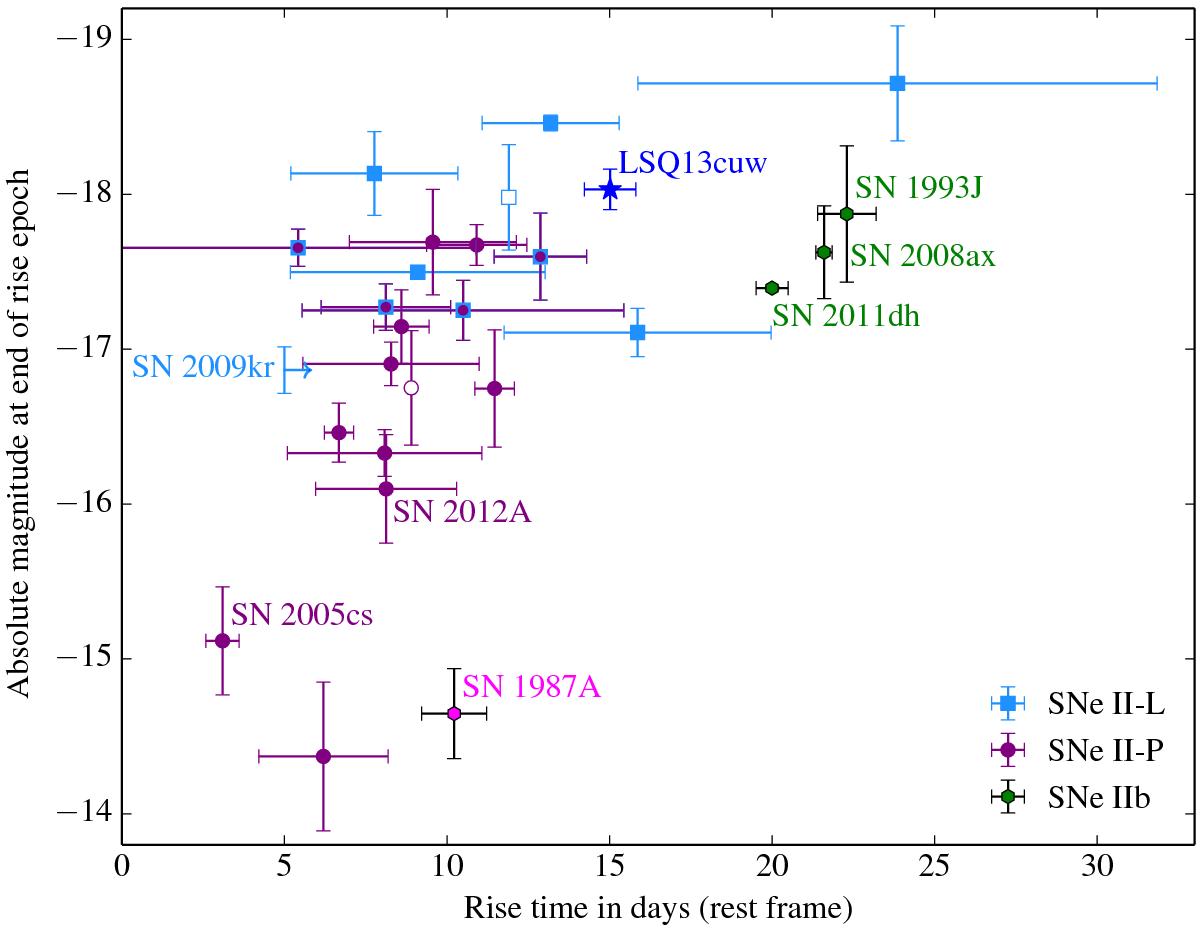
Comparison of “end-of-rise” r′/R-band absolute magnitudes and rise times. The filled squares represent SNe that were classified as Type II-L, while the filled circles are SNe that were classified as Type II-P. The empty square and circle represent rise time measurements for the R-band II-L and II-P templates from Faran et al. (2014b), respectively. As these templates are in a relative scale, we assumed the mean B-band values published by Richardson et al. (2014) as the absolute magnitudes for the two SN types, respectively. The arrow represents a lower limit for the rise time of SN 2009kr. For the individually labelled SNe 2005cs, 2009kr and 2012A direct progenitor detections have been reported (see also Sect. 3.5). The peculiar Type II-P SN 1987A and the Type IIb SNe 1993J, 2008ax and 2011dh are included for comparison (see Table B.2).
Current usage metrics show cumulative count of Article Views (full-text article views including HTML views, PDF and ePub downloads, according to the available data) and Abstracts Views on Vision4Press platform.
Data correspond to usage on the plateform after 2015. The current usage metrics is available 48-96 hours after online publication and is updated daily on week days.
Initial download of the metrics may take a while.