Fig. 7
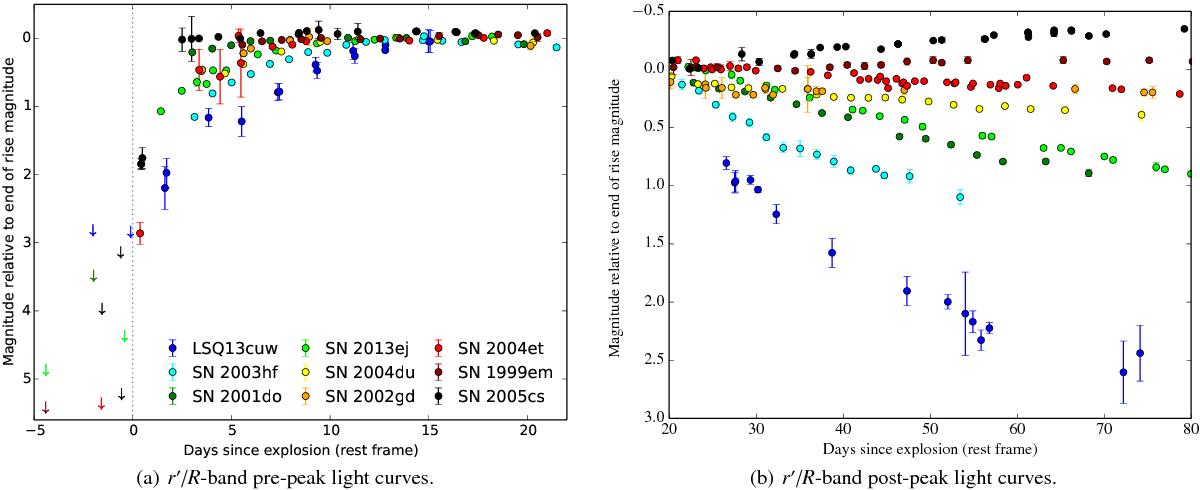
r′/R-band light curve comparison of a selection of SNe II-P and II-L from our sample. Magnitudes are plotted relative to the “end-of-rise” magnitude (see Sect. 3.2) to visualize the range in rise times and decline rates amongst the various SNe. The arrows show the limits on the pre-discovery non-detections. The dotted line marks the explosion epoch.
Current usage metrics show cumulative count of Article Views (full-text article views including HTML views, PDF and ePub downloads, according to the available data) and Abstracts Views on Vision4Press platform.
Data correspond to usage on the plateform after 2015. The current usage metrics is available 48-96 hours after online publication and is updated daily on week days.
Initial download of the metrics may take a while.