Fig. 7
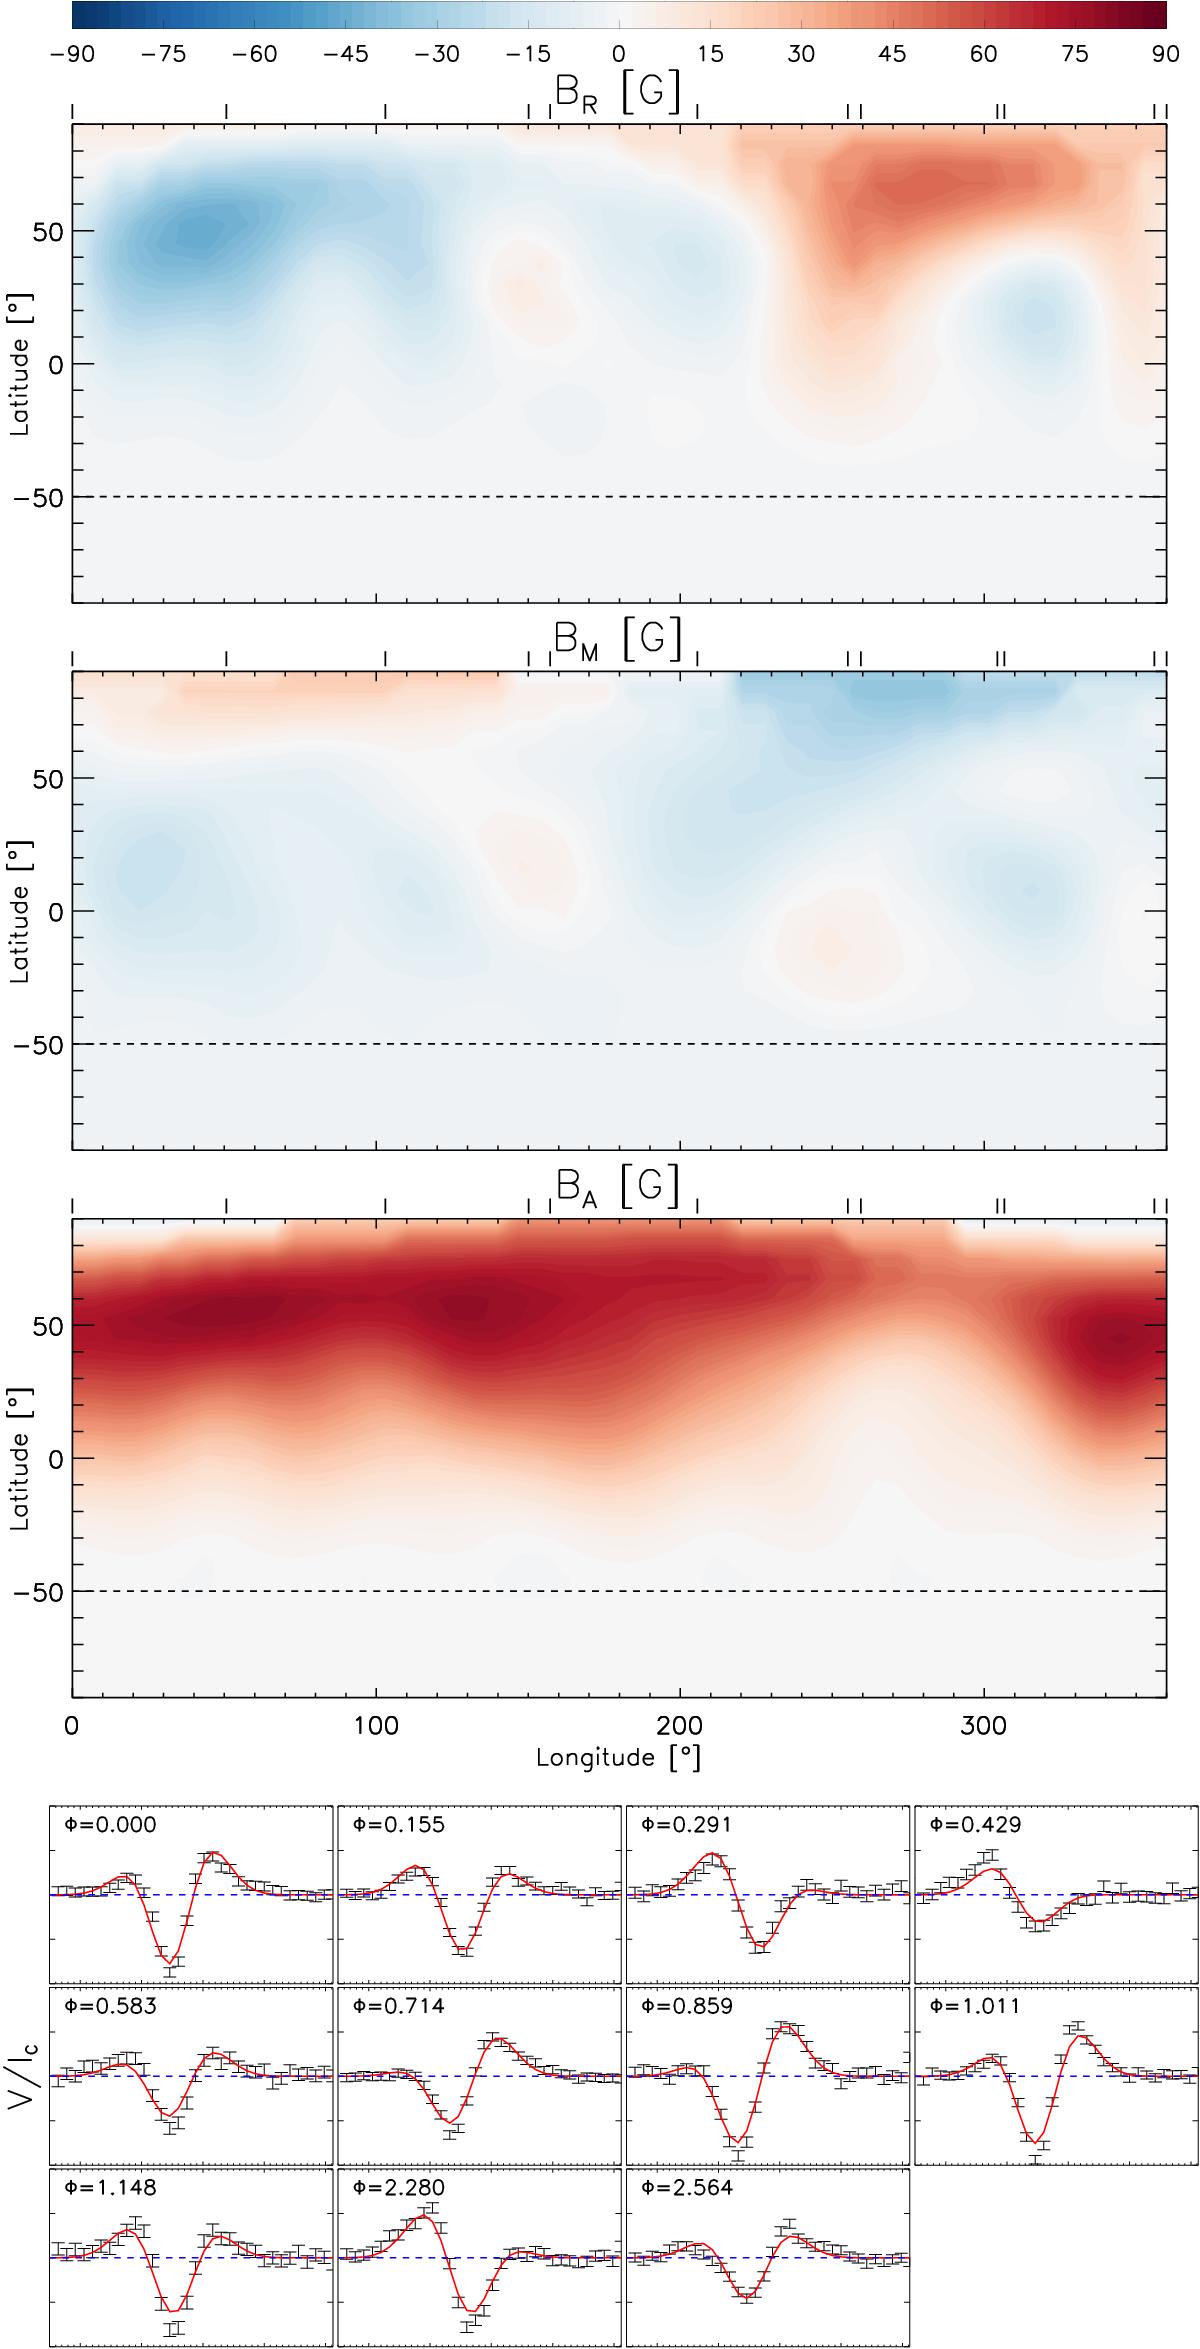
Results of the ZDI analysis for the first-epoch observations of HD 1237 using the Gaussian line profile. The first three panels show the surface magnetic field components BR, BM, and BA. The colour scale indicates the polarity and the magnitude of the magnetic field component in G, while the phase coverage is indicated by the black ticks in the upper y-axis. The segmented horizontal line indicates the surface visibility limit, imposed by the adopted inclination angle of the star (i = 50°). The last panel shows the comparison between synthetic (red) and observed (black) Stokes V profiles obtained for this particular epoch in each observational phase Φ, where the recovered maps fit the spectro-polarimetric data to an optimal reduced χ2 = 1.4.
Current usage metrics show cumulative count of Article Views (full-text article views including HTML views, PDF and ePub downloads, according to the available data) and Abstracts Views on Vision4Press platform.
Data correspond to usage on the plateform after 2015. The current usage metrics is available 48-96 hours after online publication and is updated daily on week days.
Initial download of the metrics may take a while.