Fig. 6
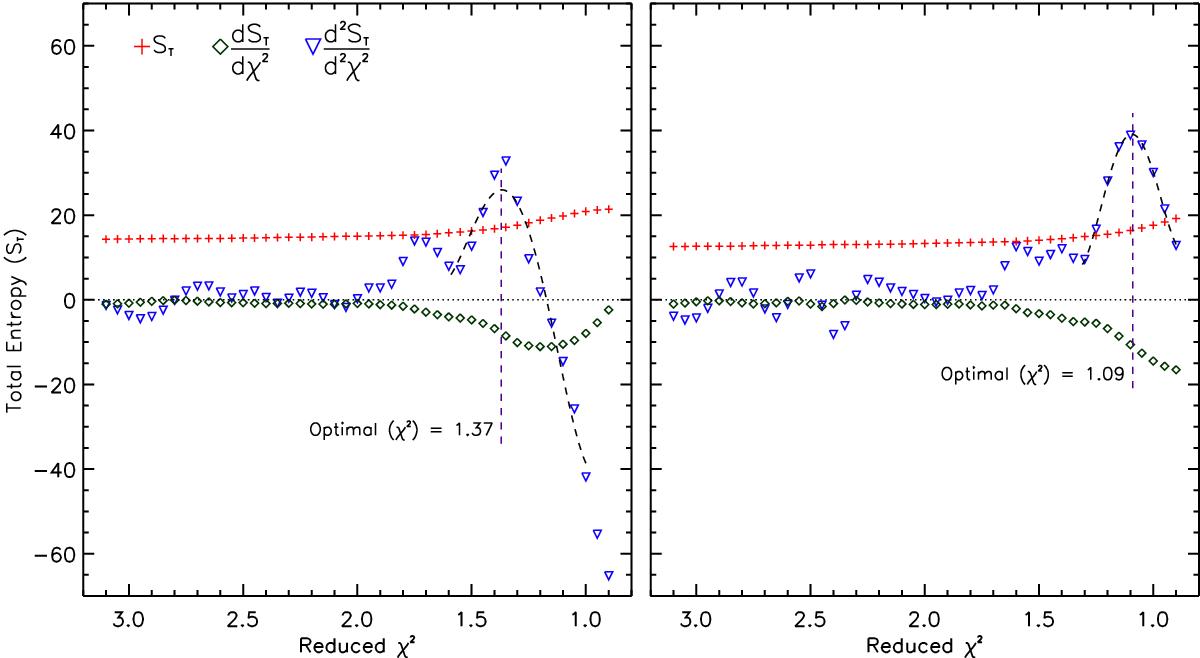
Optimal χ2 selection criteria applied to the ZDI solution set of HD 1237. Each panel contains the results for the July dataset using the Gaussian (left) and Milne-Eddington (right) line profiles. The red symbols show the behaviour of the total entropy content ST as a function of the reduced χ2. Each point corresponds to a converged ZDI solution. Green and blue symbols represent the first and second derivatives as indicated. A fourth-order polynomial fit has been applied (segmented line) to find the value for which the rate of change in the information growth (second derivative) in the ZDI solution set is maximised. The optimal fit level is indicated in each case.
Current usage metrics show cumulative count of Article Views (full-text article views including HTML views, PDF and ePub downloads, according to the available data) and Abstracts Views on Vision4Press platform.
Data correspond to usage on the plateform after 2015. The current usage metrics is available 48-96 hours after online publication and is updated daily on week days.
Initial download of the metrics may take a while.