Free Access
Fig. 5
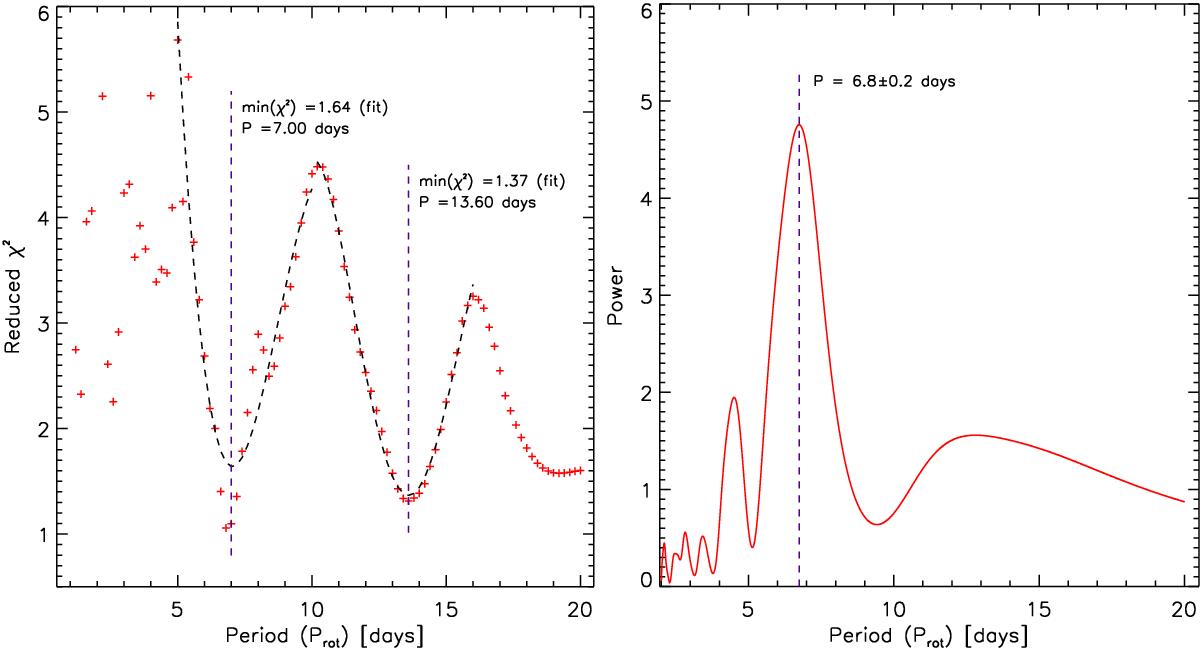
Left: minimisation results for HD 1237 showing the reduced χ2 as a function of Prot. The black segmented lines corresponds to a fourth-order polynomial fit. Right: power spectrum obtained from the Lomb-Scargle periodogram analysis on the temporal variation of Bℓ (Fig. 4).
This figure is made of several images, please see below:
Current usage metrics show cumulative count of Article Views (full-text article views including HTML views, PDF and ePub downloads, according to the available data) and Abstracts Views on Vision4Press platform.
Data correspond to usage on the plateform after 2015. The current usage metrics is available 48-96 hours after online publication and is updated daily on week days.
Initial download of the metrics may take a while.