Fig. 3
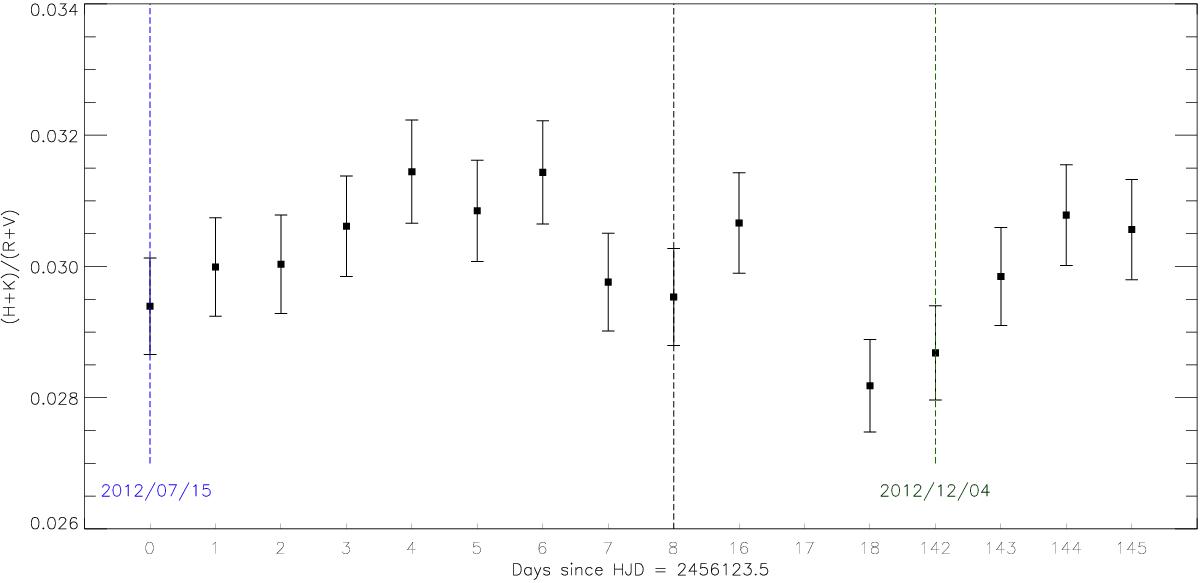
HARPS fluxes, (H + K)/(R + V), for the available observations of HD 1237. The blue and green vertical lines denote the beginning of each observed epoch. The x-axis contains the number of days since the Heliocentric Julian Date (HJD = 2 456 123.5) of the first observation (2012 Jul. 15). The last two data points of the first epoch are unevenly distributed (after the vertical black line). We estimate a 5% error in our measurements.
Current usage metrics show cumulative count of Article Views (full-text article views including HTML views, PDF and ePub downloads, according to the available data) and Abstracts Views on Vision4Press platform.
Data correspond to usage on the plateform after 2015. The current usage metrics is available 48-96 hours after online publication and is updated daily on week days.
Initial download of the metrics may take a while.